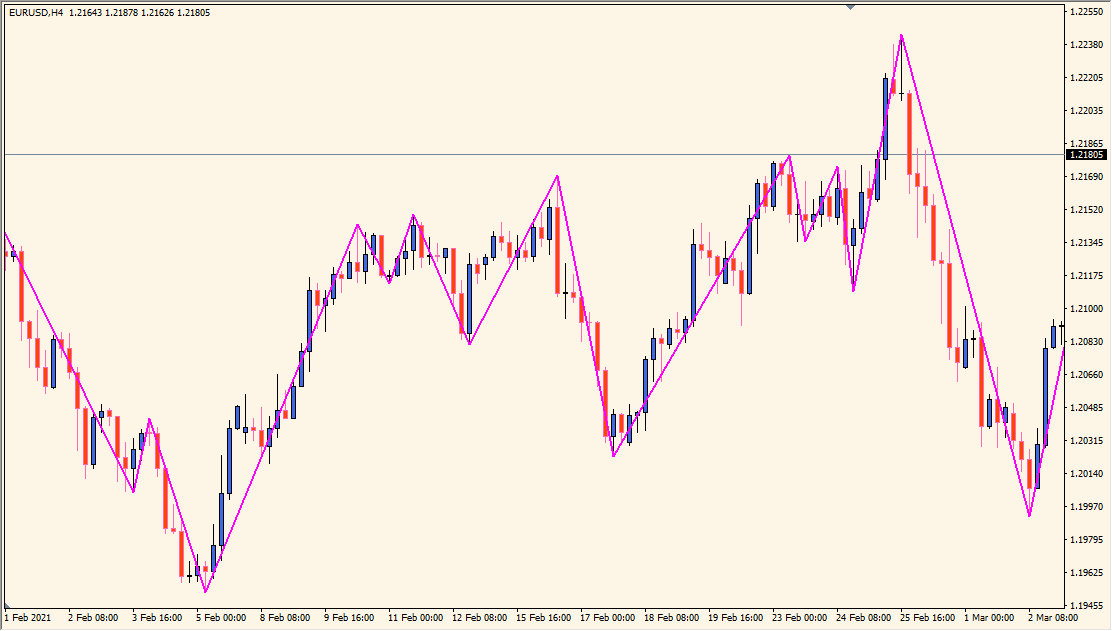
What is parabolic-zz-indicator?
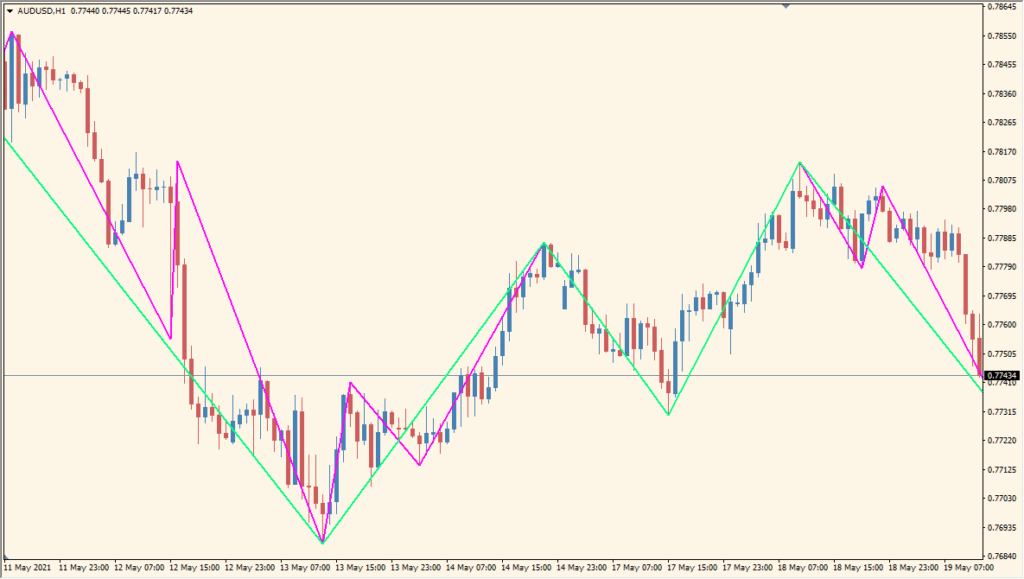
Parabolic ZZ Indicator is an MT4 tool that overlays Parabolic SAR dots with ZigZag swing points. Combining the two displays makes the relationship between short-term price movement and marked swing structure easier to review.
The SAR step, maximum, and historical bar-count settings control the plotted display. The annotations provide chart context and should be reviewed alongside the broader price structure.
How to Use It in Practice
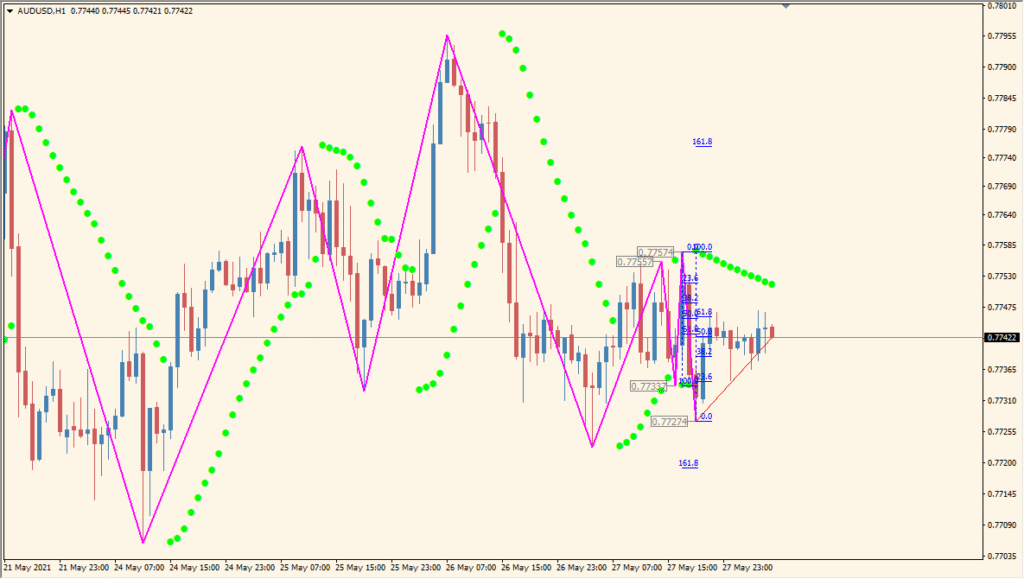
Use the combined markings as a visual chart reference:
- Add Parabolic ZZ Indicator to an MT4 chart and review the SAR dots with the ZigZag swings.
- Adjust SAR_step and SAR_maximum to change the Parabolic SAR display.
- Set BarsCount to control how much historical chart data is calculated and shown.
- Compare the two annotations with current price behavior and surrounding market context.
Parabolic SAR and ZigZag markings are available in one display, the main sensitivity settings remain visible in the Inputs, and BarsCount controls the historical view.
MT4 Indicator Parameters
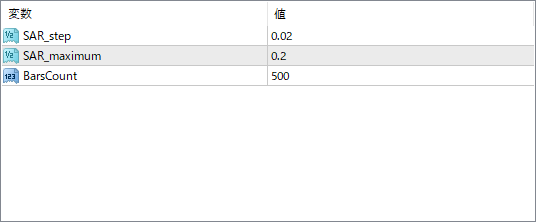
The screenshot above shows the default input parameters in the MT4 settings window.
| Parameter | Description |
|---|---|
| SAR_step | Defines the acceleration factor step size for the Parabolic SAR. Smaller values make SAR more sensitive to price changes and can generate earlier signals. |
| SAR_maximum | Sets the maximum value the acceleration factor can reach. Higher values make SAR follow the price more closely. |
| BarsCount | Specifies how many historical bars the indicator will calculate and display. A larger number shows more past data, useful for backtesting visual patterns. |


