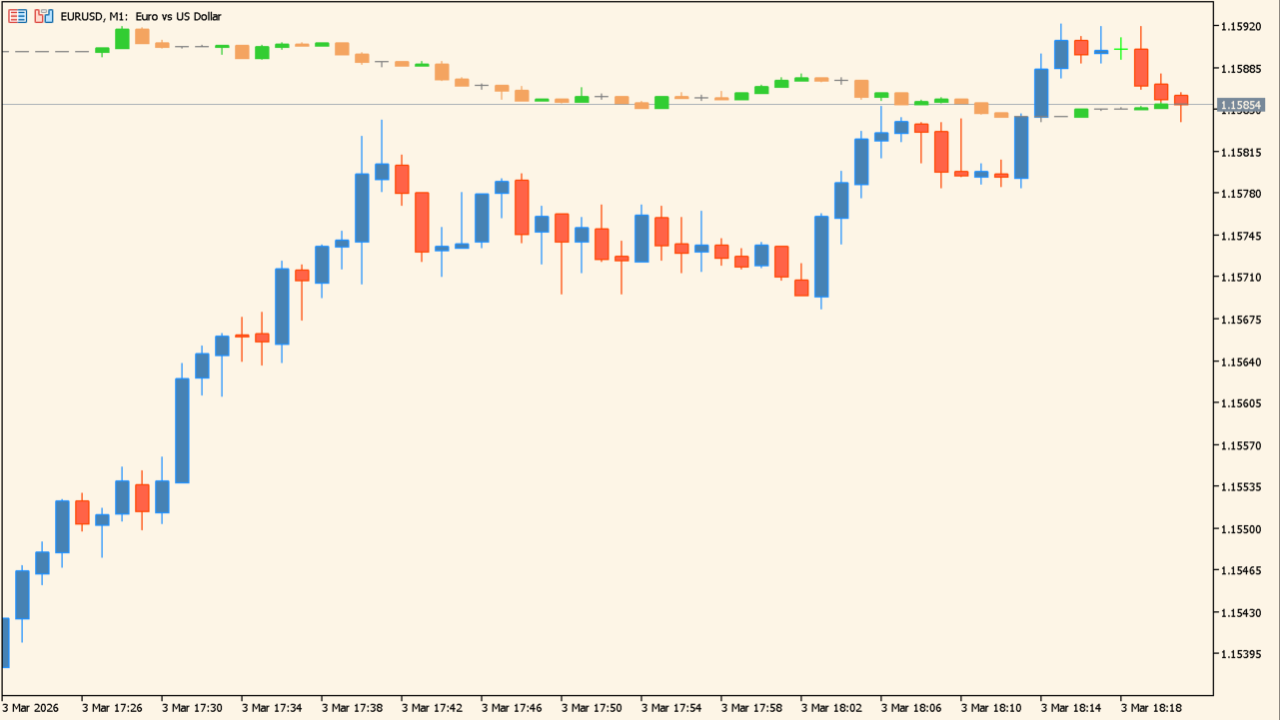
What is Peace Of Mind?
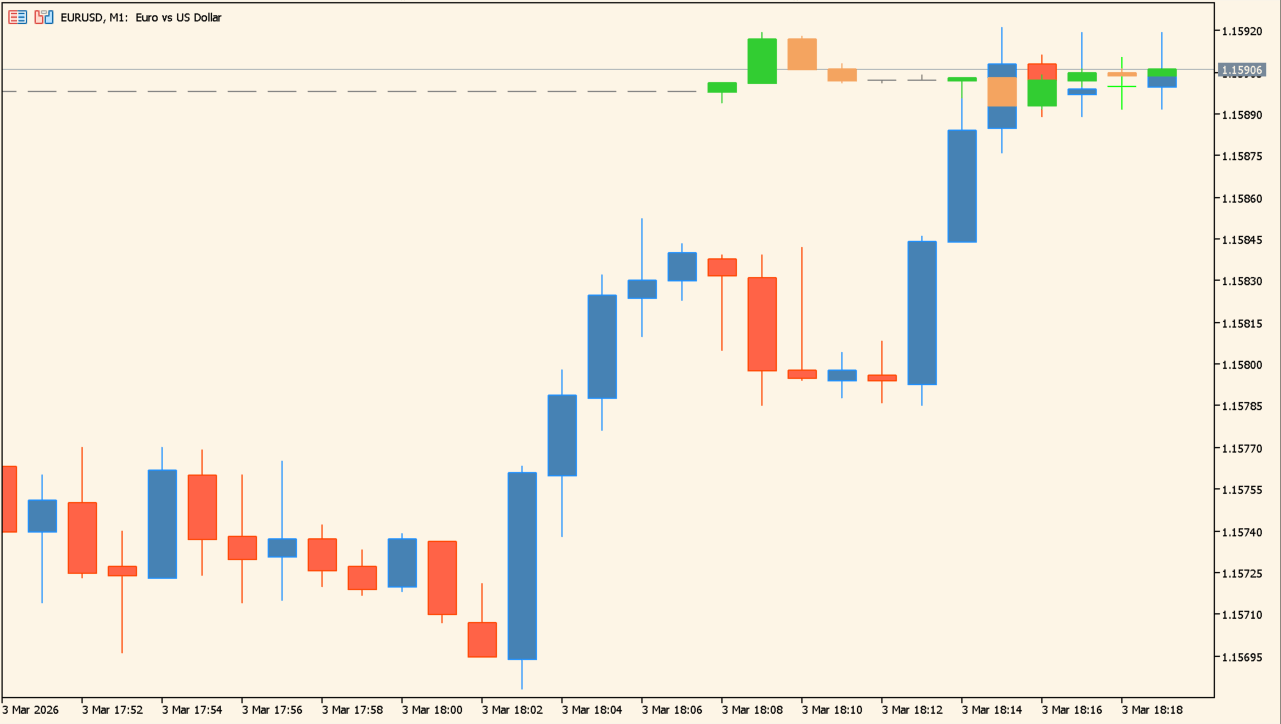
Adding the indicator to a chart starts generating the custom candles.
Peace Of Mind builds candles from tick data at an interval in seconds that you choose, and draws them on the main MT5 chart as a simulated seconds chart.
It plots candles only, with no directional marker. Seconds for candles interval sets the length of each candle.
How to use Peace Of Mind
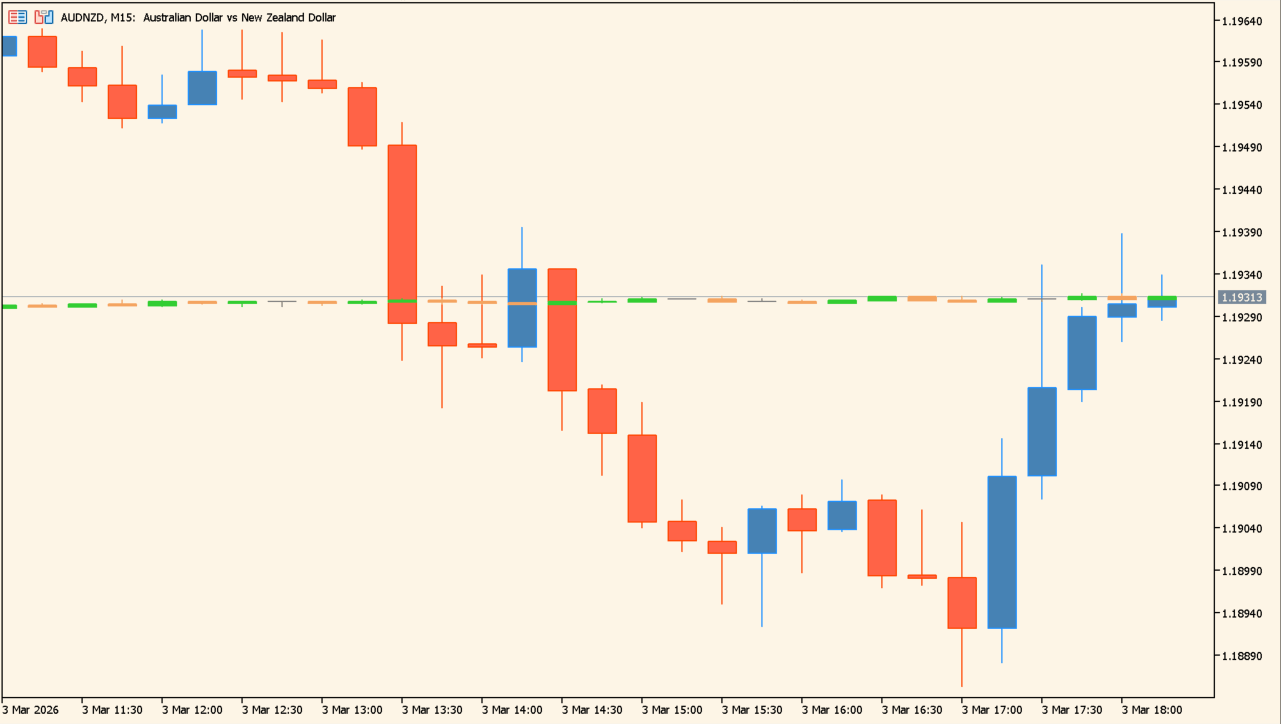
At a one-second interval there is little movement to show, so the candles stay almost flat.
Apply the indicator to an MT5 chart and enter the length you want in Seconds for candles interval. A new candle then forms at every interval, showing price movement below the one-minute chart that MT5 offers as its shortest standard timeframe.
Check how the display behaves when the indicator runs alongside other tools, since these candles are built differently from ordinary timeframes. Raise the interval when a very short setting leaves the candles almost flat.
Where it helps
MT5 charts begin at the one-minute timeframe, and this indicator draws candles measured in seconds instead.
Movement that a one-minute candle compresses into one bar is spread across several, so the sequence within it stays readable.
Seconds for candles interval is the only setting, so the candle length is raised or lowered in a single step.
MT5 Indicator Parameters
The table below lists the available MT5 indicator parameters. You can customize these options in the MetaTrader Inputs dialog to match your trading preferences.
| Parameter | Description |
|---|---|
| Seconds for candles interval | Sets the number of seconds used to form each custom candle. |
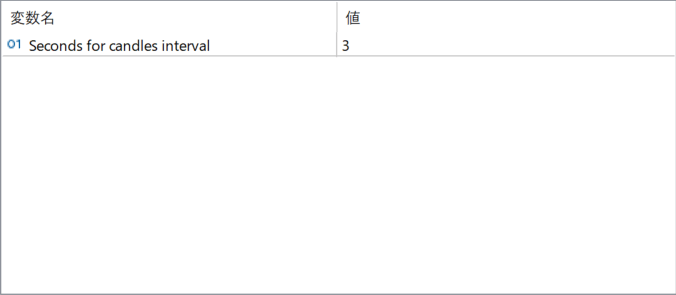
The screenshot above shows the default input parameters in the MT5 settings window.
How to Install .ex5 Indicator in MetaTrader 5
- Download the ZIP file and extract it.
- In MT5, select File → Open Data Folder.
- Open MQL5 → Indicators and copy the EX5 or MQ5 file into it.
- If the package includes library files, copy them to MQL5 → Libraries. Copy TPL files to the top-level templates folder.
- Restart MT5, find the indicator in the Navigator, and drag it onto a chart.
Test the tool on a demo account first. File contents and required folders can vary between packages.


