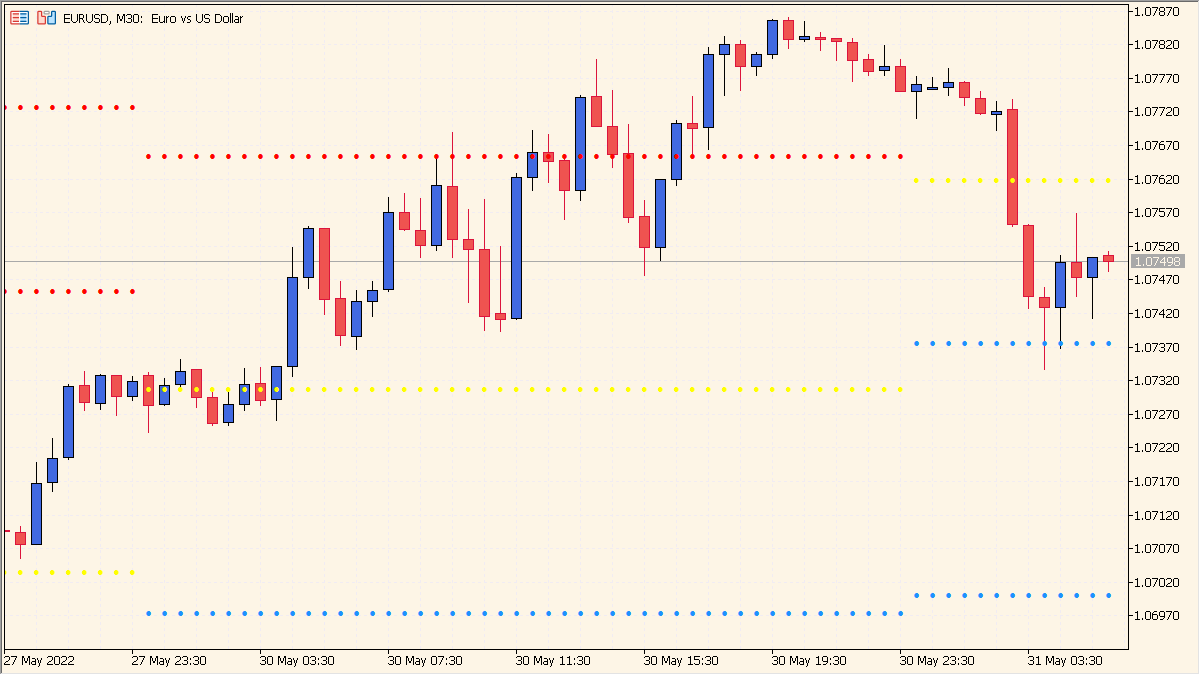
What is PivotPoint Indicator?
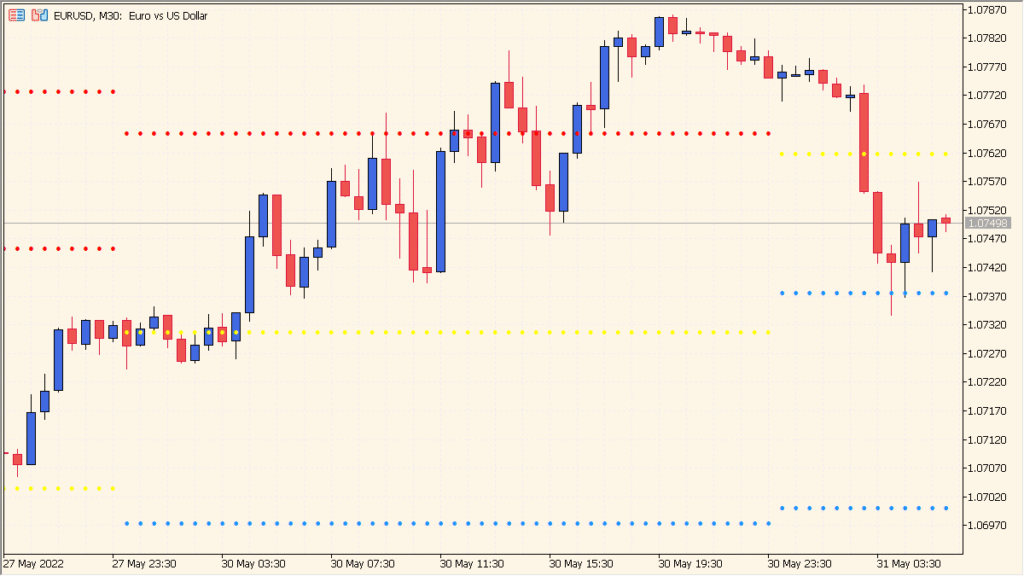
PivotPoint is an MT5 chart indicator that displays a central pivot with related S1/S2 and R1/R2 reference lines calculated from the selected prior period.
The calculation period can be selected as daily, weekly, or monthly, allowing the same level group to be shown at three time horizons.
How to Use It in Practice
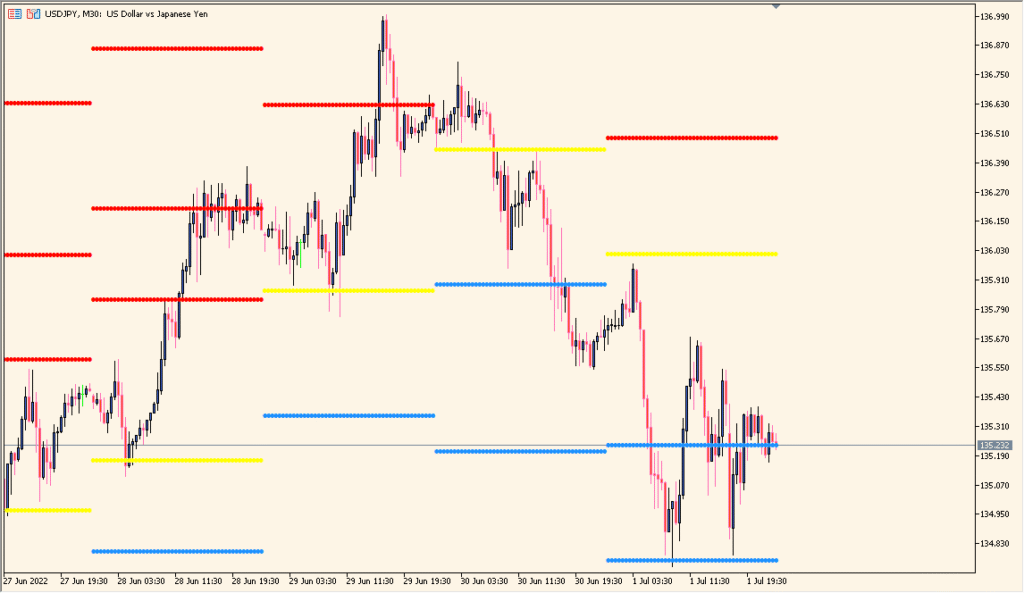
PivotPoint draws the central PP from the prior high, low, and close, then lays out the associated S1/S2 and R1/R2 levels. The central PP is drawn in yellow, with the related level groups above and below it.
- Read the central PP together with the S1/S2 and R1/R2 lines rather than treating a single line in isolation.
- Choose daily, weekly, or monthly calculation time from the parameter selection.
- Compare the active chart candles with the level set derived from the selected prior period.
Daily reference levels are grouped in one overlay, labels support orientation, and styling controls keep the chart readable.
MT5 Indicator Parameters
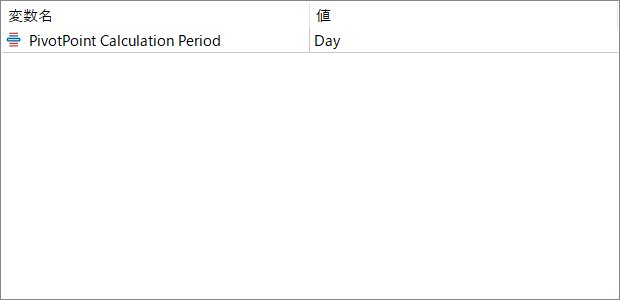
The screenshot above shows the default input parameters in the MT5 settings window.
| Parameter | Description |
|---|---|
| PivotPoint Calculation Period | Specifies the time period used for pivot calculations (e.g., Day, Week, or Month). Choosing “Day” calculates pivots based on the previous day’s high, low, and close, making it ideal for short-term trading. Weekly or monthly settings suit swing or position traders. |


