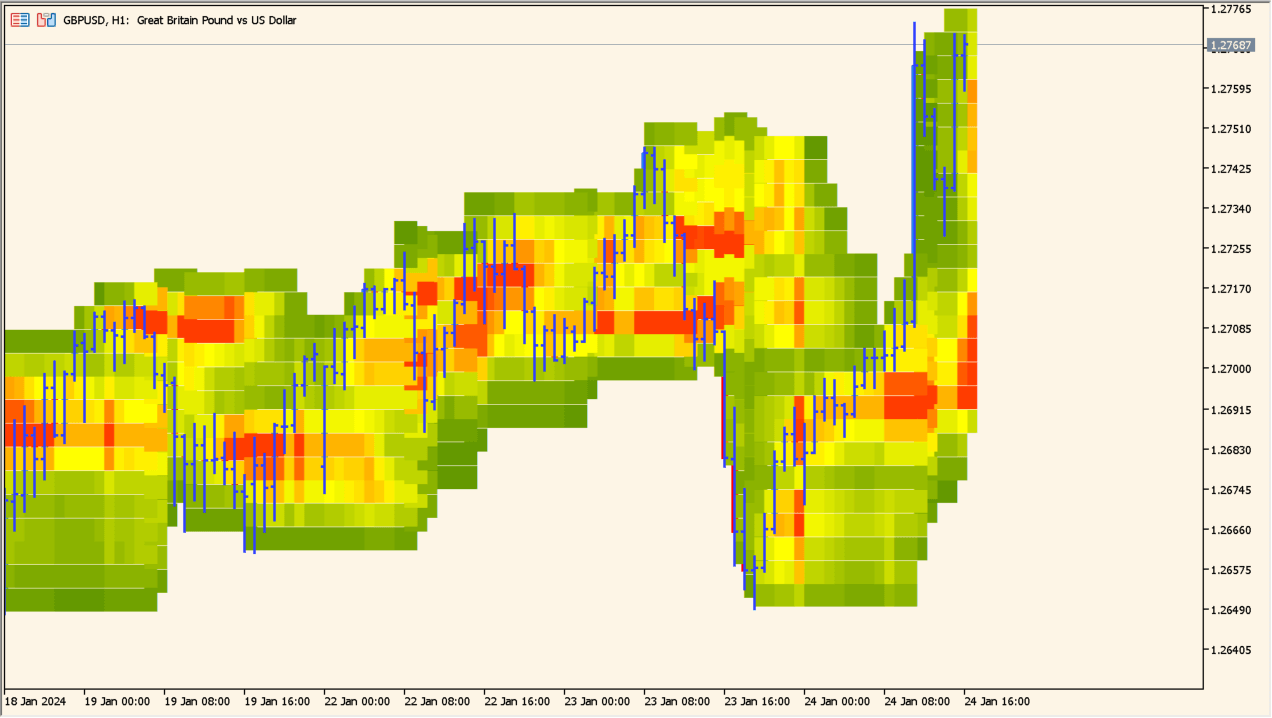
What is price-heatmap-v1-05-indicator 1.05 Indicator?
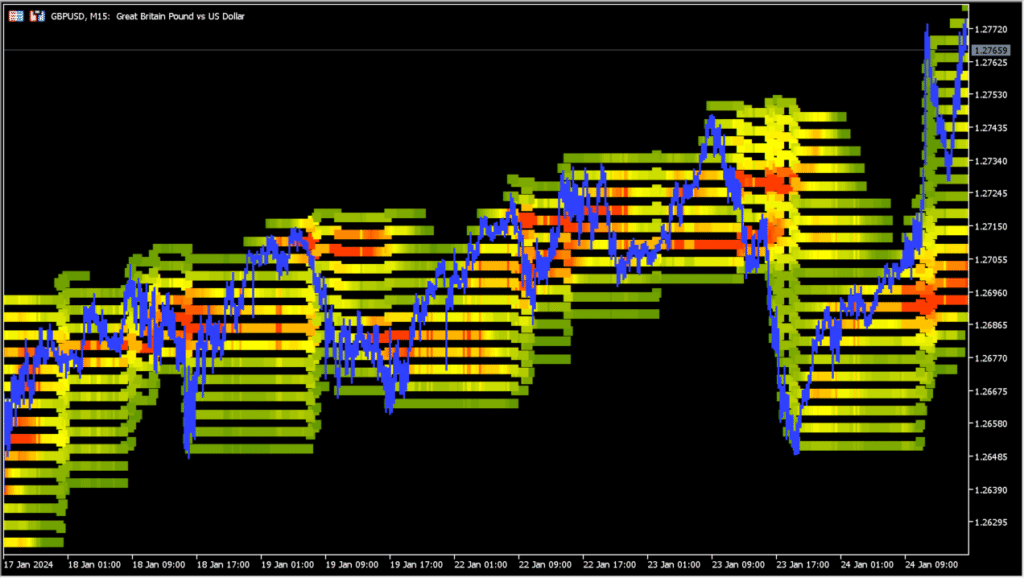
Price Heatmap 1.05 is an MT5 chart indicator that displays price activity as colored histogram or heatmap bins across a selected range. Range, bin size, session, and color settings determine the visible concentration areas.
The heatmap organizes historical activity and balance for visual comparison with current price. It records the selected sample for chart context.
How to Use It in Practice
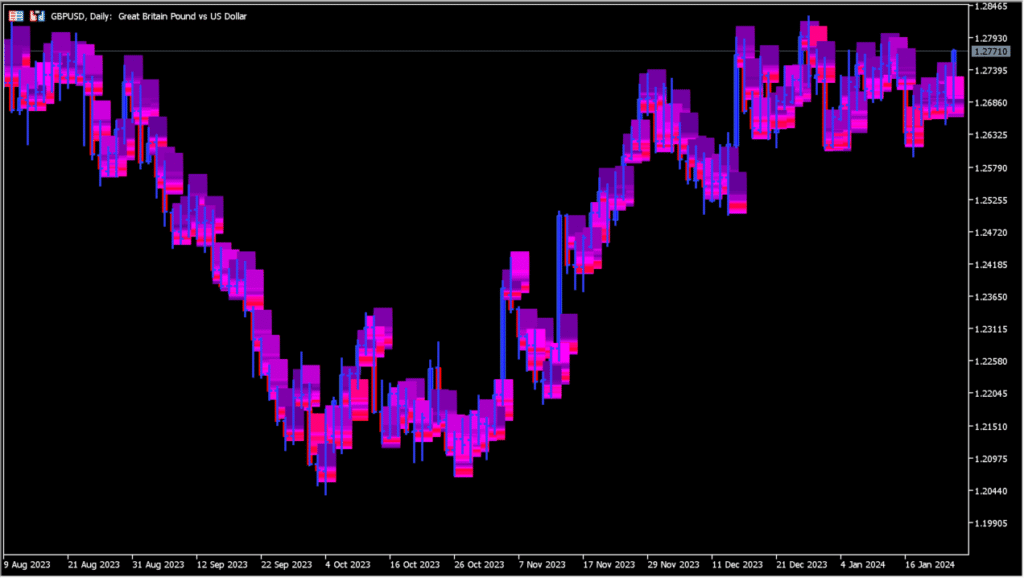
Inspect the red concentration zones and optional bar display as a map of the price areas where candles spent more time:
Price activity is visible by level, color intensity supports quick comparison, and range controls allow different sessions to be reviewed.
- Locate the red lines or zones first, then compare them with the candle history to see where the displayed time concentration accumulated.
- Adjust the chart scale and the time-related display settings when the heatmap is too dense to read; this adjustment matters for legibility.
- Use the color controls and bar on or off option to decide whether the additional bar chart makes the candle view clearer or more crowded.
- When many zones are scattered across the chart, keep that limitation visible in the review; a dispersed display can reduce practical readability.
MT5 Indicator Parameters
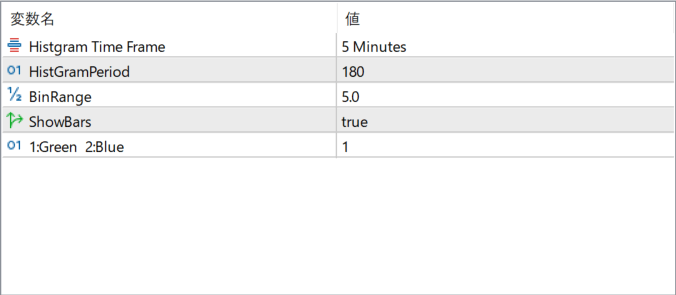
The screenshot above shows the default input parameters in the MT5 settings window.
| Parameter | Description |
|---|---|
| Histogram Time Frame | Sets the timeframe used to build the price histogram. Higher timeframes show broader market structure, while lower timeframes focus on short-term value areas. |
| HistGramPeriod | Defines how many bars are included in the heatmap calculation. Increasing this value creates a wider historical view, while reducing it emphasizes recent price activity. |
| BinRange | Controls the price interval used for each histogram bin. Smaller values create finer detail, while larger values simplify the heatmap into broader zones. |
| ShowBars | Enables or disables the display of histogram bars on the chart, allowing you to focus purely on price if needed. |
| 1:Green 2:Blue | Switches between color display modes for the heatmap, helping adjust contrast and readability depending on chart background. |


