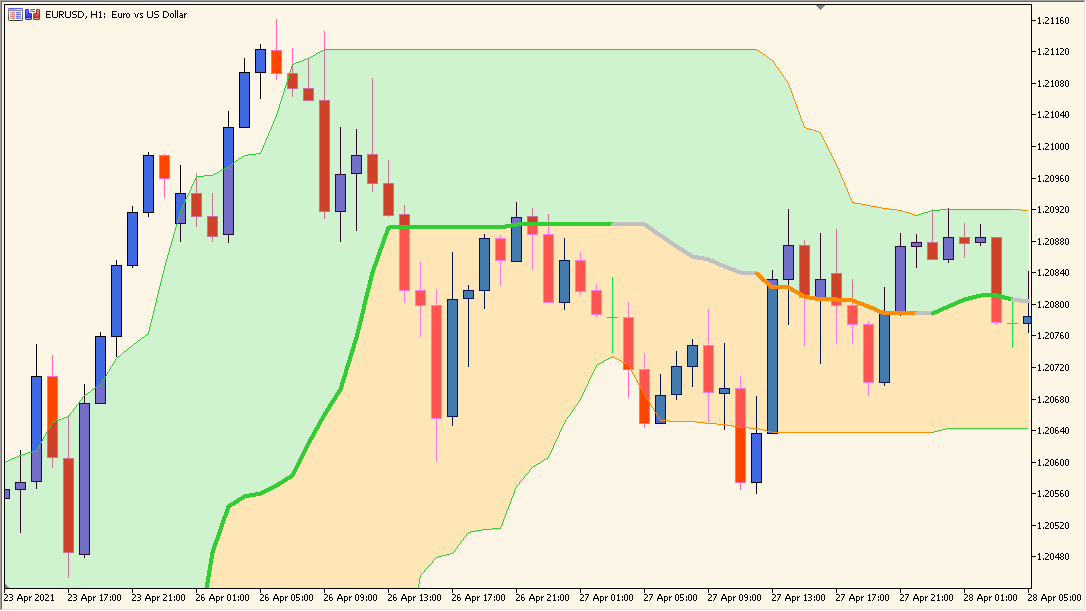
What is Quantile-Bands Indicator?
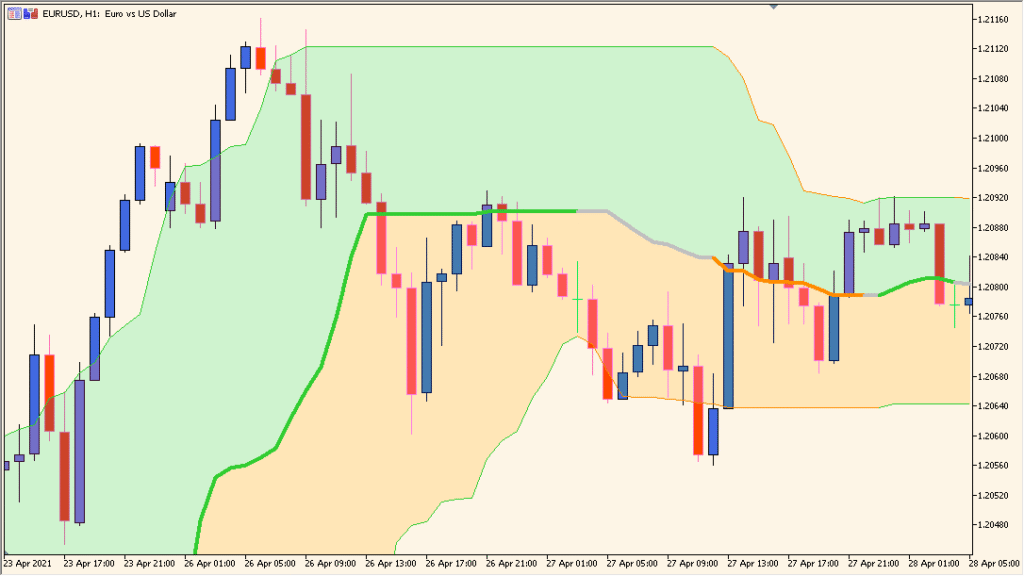
Quantile Bands for MT5 calculates upper, middle, and lower references from selected price quantiles over a defined period. Unlike a standard-deviation band, the display is based on the distribution of the chosen price data.
The timeframe, quantile period, price sources, band percentages, and interpolation option are configurable. The resulting bands provide a compact view of where recent price values sit within the selected distribution.
How to Use It in Practice
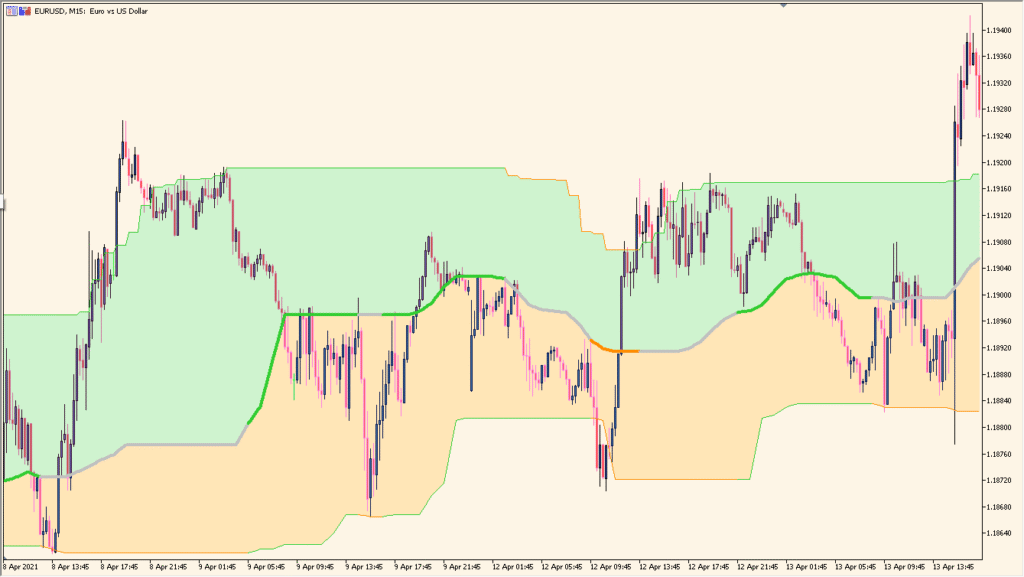
Quantile Bands shows a colored center line and upper/lower bands. Green marks an upward center-line state, orange a downward state, and gray a ranging state, while a widening or narrowing band shows a change in displayed volatility.
- Read the center-line color together with the upper and lower band width, and compare those elements with the active candles.
- Set Time Frame to choose the display timeframe; both the active 15-minute band and an H1 band can be shown on a 15-minute chart.
- Change Quantile period to alter the response speed, but avoid an excessively short period because it makes the display noisier.
Three distribution-based references are displayed together, price sources and quantile percentages can be adjusted, and timeframe selection supports broader chart context.
MT5 Indicator Parameters
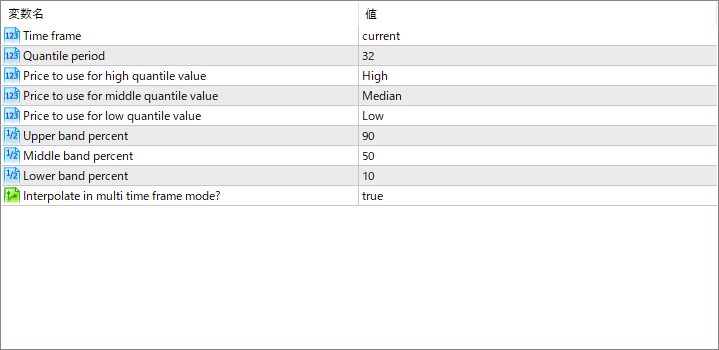
The screenshot above shows the default input parameters in the MT5 settings window.
| Parameter | Description |
|---|---|
| Time frame | Specifies which chart timeframe the indicator should use. You can analyze quantiles based on a higher or current timeframe. |
| Quantile period | Sets the number of candles used to calculate quantile bands. A larger period smooths out the bands and gives a broader view of price distribution. |
| Price to use for high quantile value | Defines which price (e.g., High, Close) is used when computing the upper quantile threshold. |
| Price to use for middle quantile bands | Specifies which price is used to calculate the median quantile, often set to Median or Close. |
| Price to use for low quantile value | Chooses the price input for calculating the lower quantile boundary. |
| Upper band percent | Defines the quantile level for the upper band (e.g., 90% means price rarely exceeds this level). |
| Middle band percent | Sets the quantile level used for the central band, typically the 50% median. |
| Lower band percent | Defines the quantile for the lower band, such as 10% (price usually stays above this level). |
| Interpolate in multi time frame mode? | When enabled, smooths the quantile lines when using a higher timeframe than the current chart for better visual alignment. |


