What is Quantum_Donchain_MurreyMath_V1 Indicator?
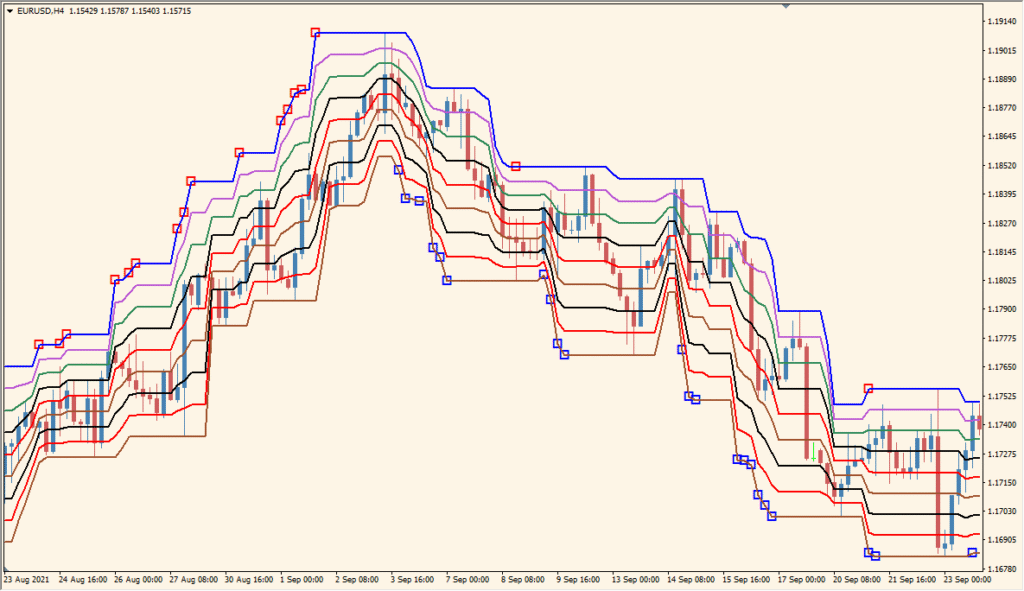
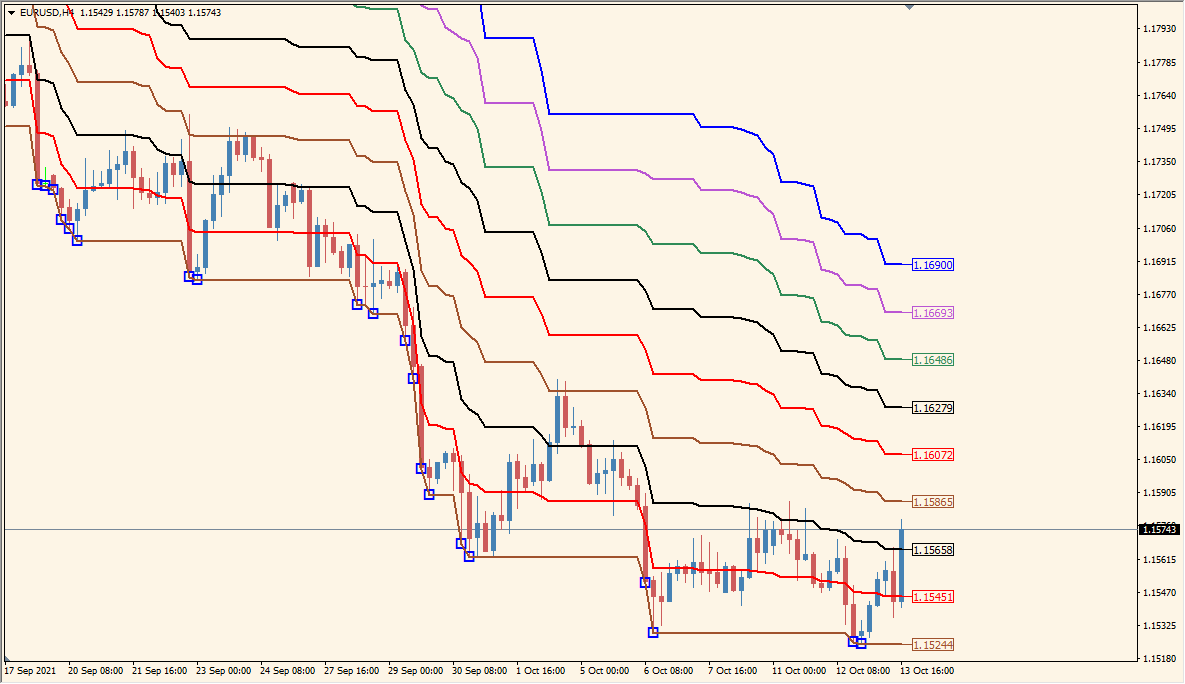
The Quantum_Donchain_MurreyMath_V1 indicator combines Donchian channel logic with Fibonacci and Murrey Math principles. It displays dynamic horizontal levels that act as support and resistance zones based on historical high/low ranges. These levels are spaced according to Fibonacci-derived percentages, offering a colorful and informative structure to price movement.
This makes it easier to visually identify areas of potential breakout, reversal, or consolidation. Each Fibonacci level is color-coded for quick recognition and layered over the price chart for real-time reference.
How to Use It in Practice
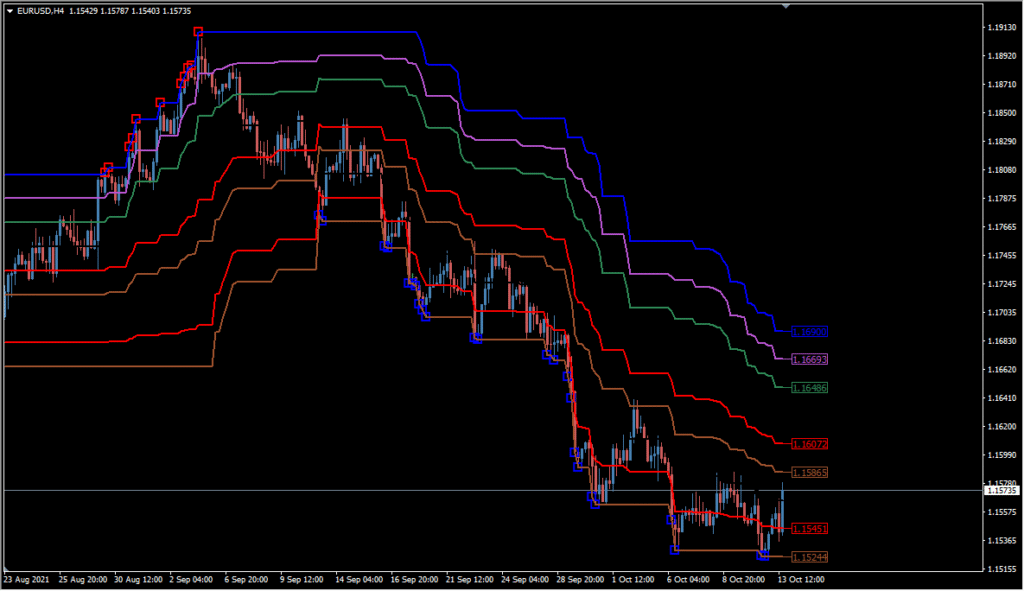
In live trading, this indicator helps you:
- Identify high-probability support and resistance areas based on historical price extremes.
- Use Fibonacci and Murrey-based levels for setting stop-loss, take-profit, or entry points.
- Gauge potential price targets during trending or ranging markets.
- Enhance visual clarity with clear color-coded level lines to reduce noise.
Traders who rely on structure, levels, or breakout strategies will find this tool helpful for enhancing their chart analysis.
Best Settings & MT4 Parameters for Quantum_Donchain_MurreyMath_V1
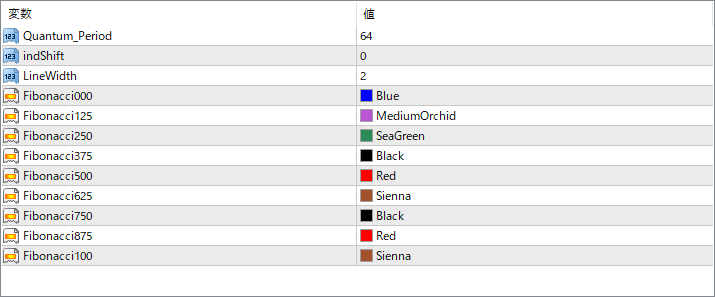
Quantum_Period
Sets the lookback period for calculating the Donchian channel highs and lows. A larger value widens the bands based on broader price history.
indShift
Shifts the entire indicator left or right on the chart for visualization purposes without affecting calculations.
LineWidth
Sets the thickness of the horizontal lines drawn on the chart. Thicker lines offer stronger visual emphasis.
Fibonacci000
Color for the 0% Fibonacci level (bottom line).
Fibonacci125
Color for the 12.5% level.
Fibonacci250
Color for the 25% level.
Fibonacci375
Color for the 37.5% level.
Fibonacci500
Color for the midpoint 50% level, often seen as key support or resistance.
Fibonacci625
Color for the 62.5% level.
Fibonacci750
Color for the 75% level.
Fibonacci875
Color for the 87.5% level.
Fibonacci100
Color for the top 100% Fibonacci level (upper Donchian boundary).