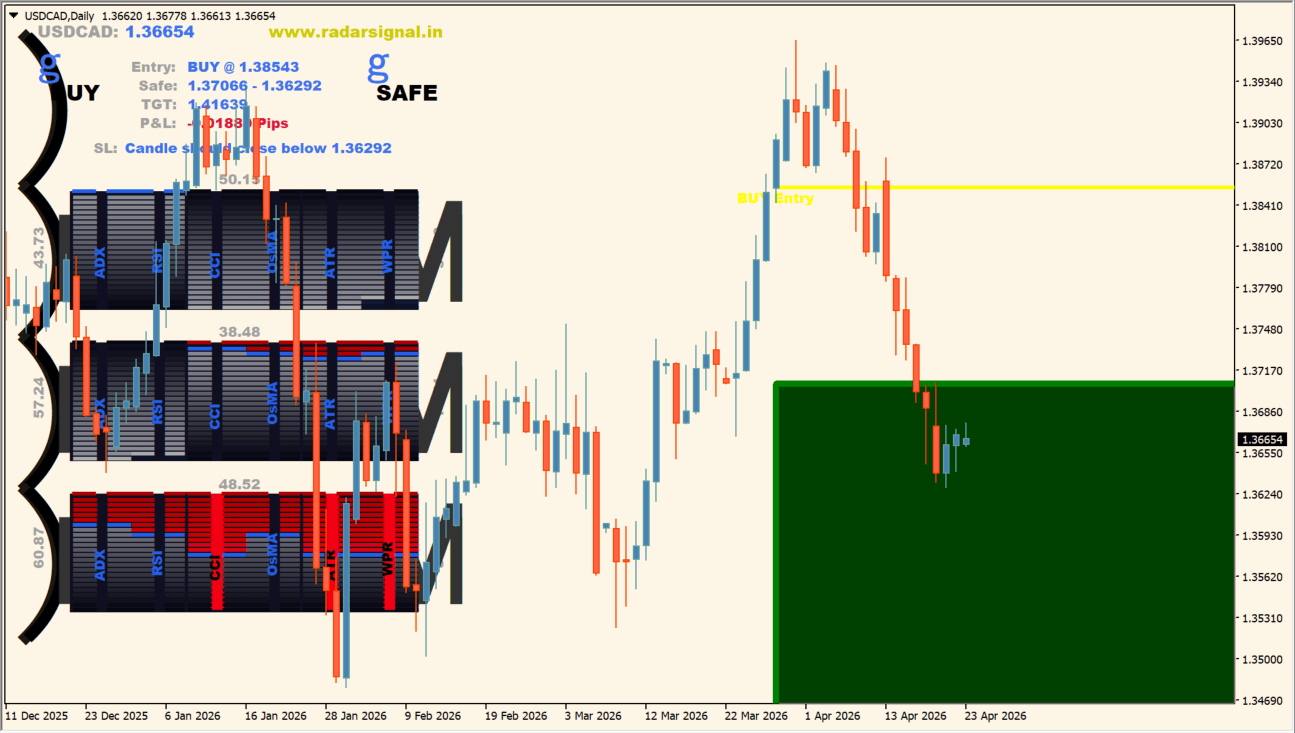
What is Radar Signal MT4?
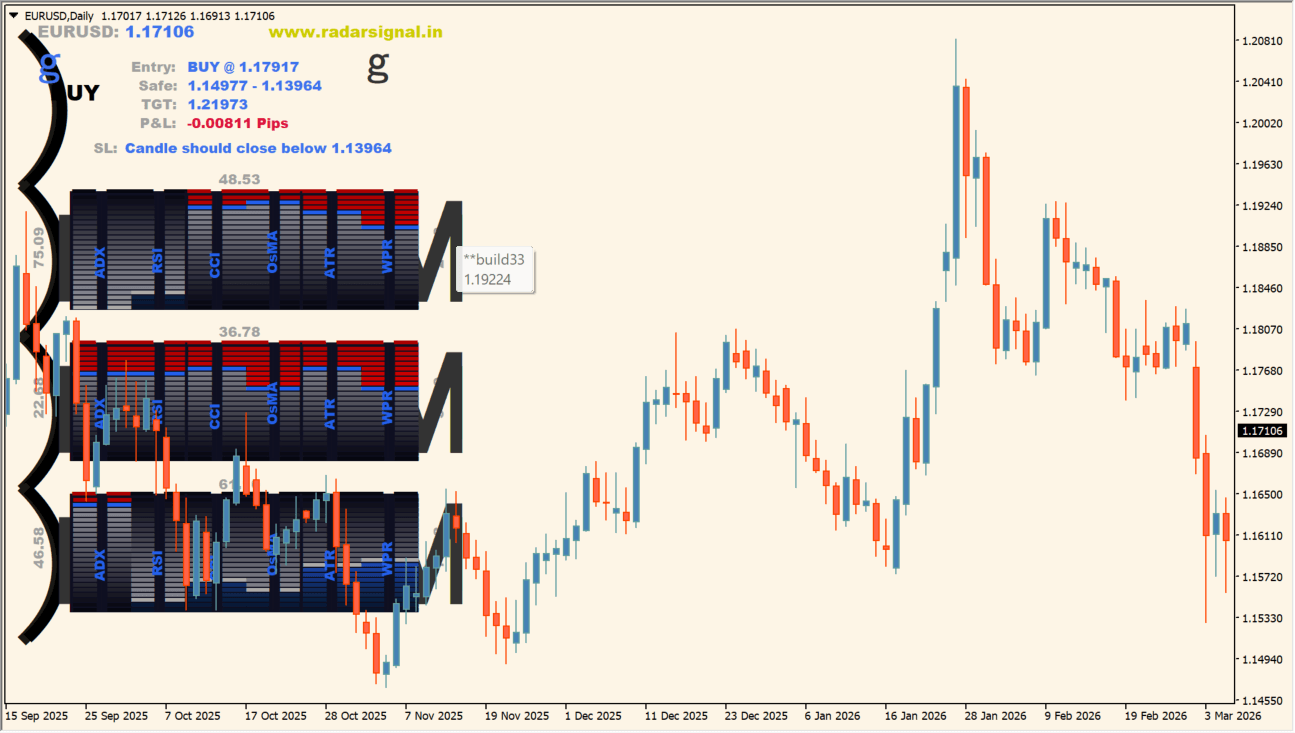
Radar Signal MT4 combines ADX, RSI, CCI, OsMA, ATR, and WPR readings in a large chart overlay. Three gauge rows cover long-, medium-, and short-term conditions, and the header prints Entry, Safe, TGT, P&L, and SL fields.
Blue marks a buying bias and red marks a selling bias. Gauge length is not a simple on-or-off state: a longer bar means stronger pressure in that direction, and a shorter bar sits closer to neutral.
How to use Radar Signal MT4
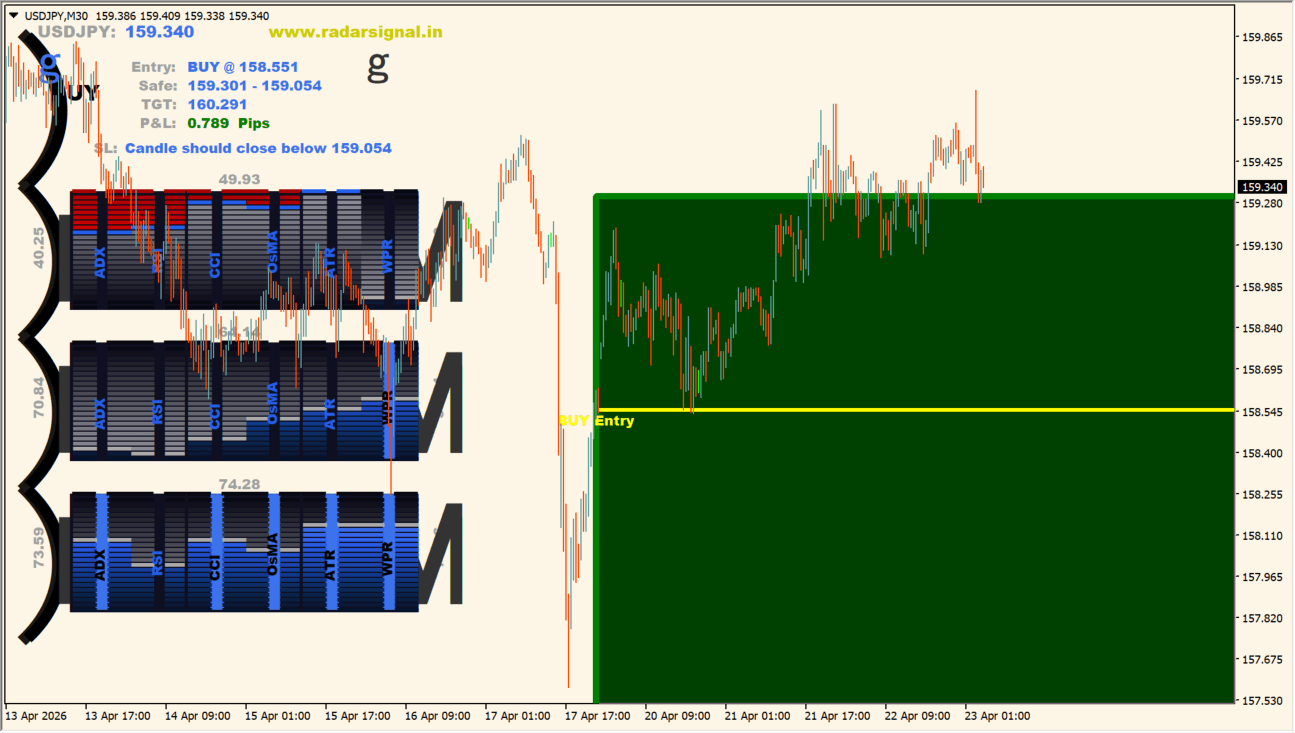
Read the panel for agreement across the rows rather than for a single reading:
- Look for several of the indicators pointing the same way at the same time instead of acting on one row.
- Use ADX as the reading that shows whether a trend is present at all.
- Read gauge length as strength: a long bar is stronger pressure and a short bar is closer to neutral, and compare the long-, medium-, and short-term rows together.
- Treat the Entry, Safe, TGT, P&L, and SL header fields as reference values and check the swing structure, the spread, and the room to the next barrier on the chart; this indicator exposes no adjustable inputs.
Where it helps
ADX, RSI, CCI, OsMA, ATR, and WPR states appear side by side in a single overlay, the long-, medium-, and short-term gauge rows show where the readings agree and where they conflict, and gauge length keeps near-neutral readings distinguishable from strong ones.
MT4 Indicator Parameters
The table below lists the available MT4 indicator parameters. You can customize these options in the MetaTrader Inputs dialog to match your trading preferences.
| Parameter | Description |
|---|---|
| No Configurable Parameters | This indicator does not expose adjustable inputs. Default: —. |
How to Install .ex4 Indicator in MetaTrader 4
- Download the ZIP file and extract it.
- In MT4, select File → Open Data Folder.
- Open MQL4 → Indicators and copy the EX4 or MQ4 file into it.
- If the package includes library files, copy them to MQL4 → Libraries. Copy TPL files to the top-level templates folder.
- Restart MT4, find the indicator in the Navigator, and drag it onto a chart.
Test the tool on a demo account first. File contents and required folders can vary between packages.


