What is Regression Channel 2.0 Indicator?
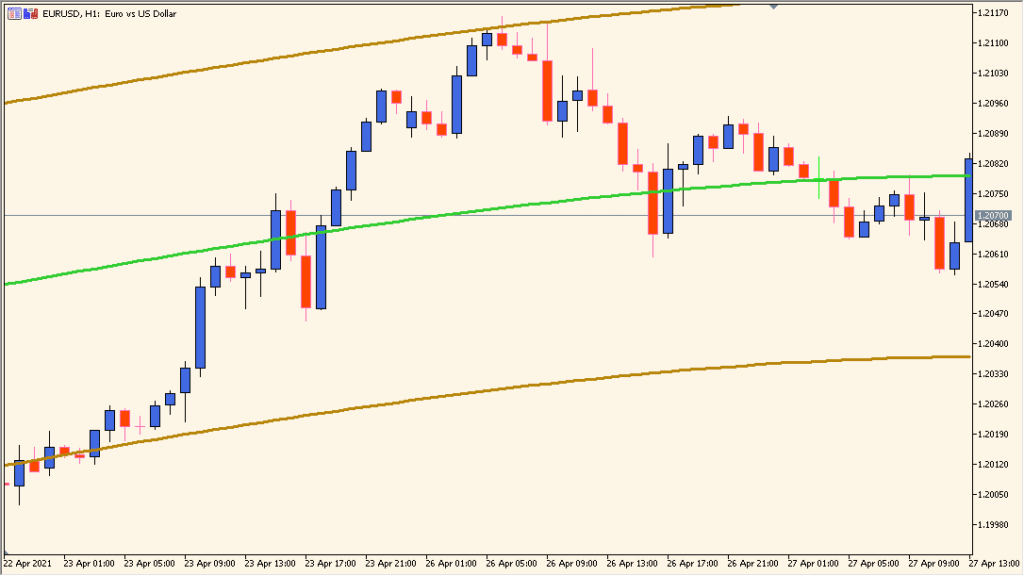
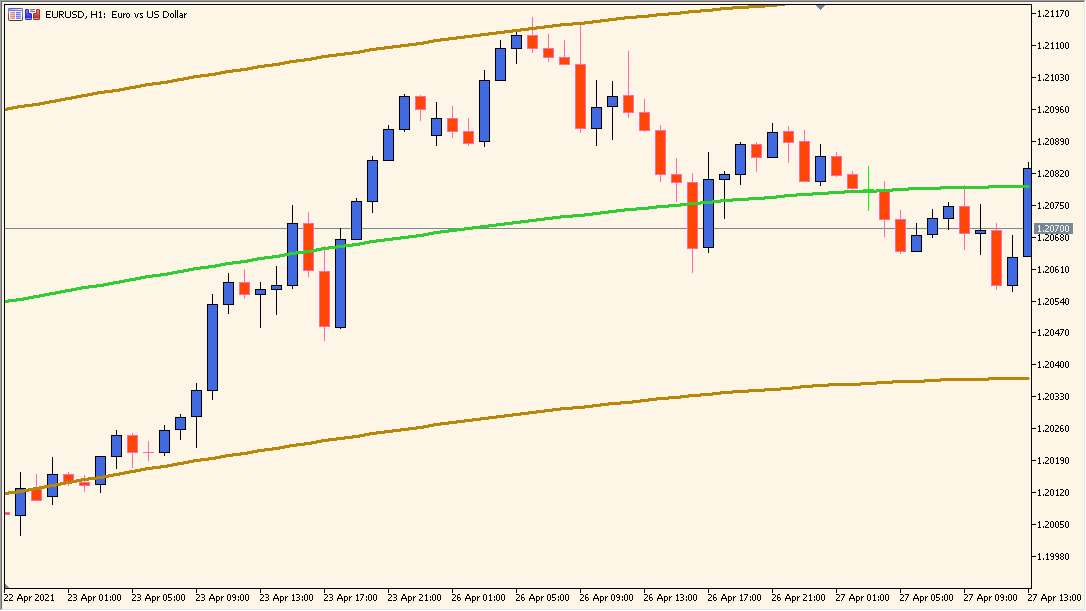
Regression Channel 2.0 is an MT5 chart indicator that draws a polynomial regression line with upper and lower bands based on displayed deviation settings. The central line and surrounding channel organize recent price behavior in one view.
Channel width provides visual context for comparing price location with the regression path. The bands are reference lines for chart review rather than fixed reaction areas.
How to Use It in Practice
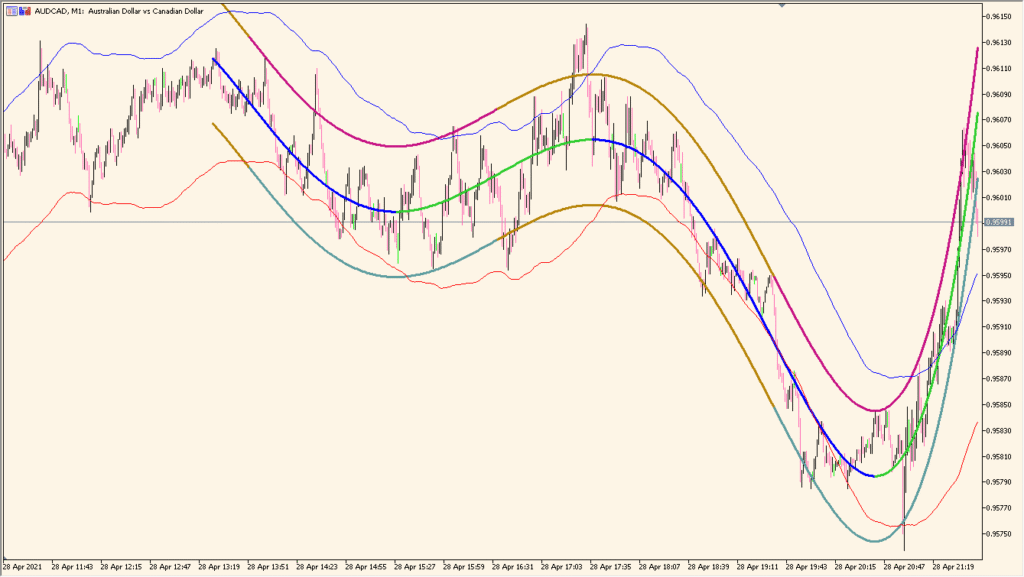
Read the curved center path and its equally spaced upper and lower channel lines as a regression drawing over the selected sample:
- Compare the shape and width of the channel with the candle range selected by the calculation.
- Use degree and kstd to alter the channel response, and use bar to change the number of candles included in the statistical sample.
- Recheck the drawing after changing bar: a much longer sample can produce a materially different channel.
A curved regression path and deviation bands share one chart view, while period and styling controls keep the display adaptable.
MT5 Indicator Parameters
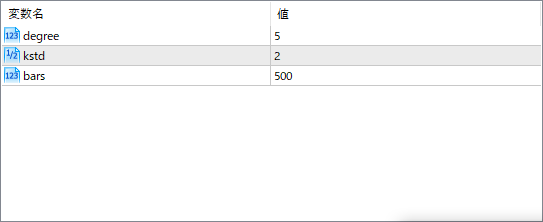
The screenshot above shows the default input parameters in the MT5 settings window.
| Parameter | Description |
|---|---|
| degree | Controls the degree of the polynomial used to create the regression line. Higher values make the line more curved and sensitive to price swings, while lower values keep it smoother. |
| kstd | Sets the number of standard deviations used to draw the upper and lower boundaries. Increasing this value widens the channel, capturing more price movement. |
| bars | Defines how many historical bars are used in calculating the regression. More bars give a broader view of price behavior, while fewer bars make the channel react faster to recent changes. |


