What is RSI Divergence Indicator?
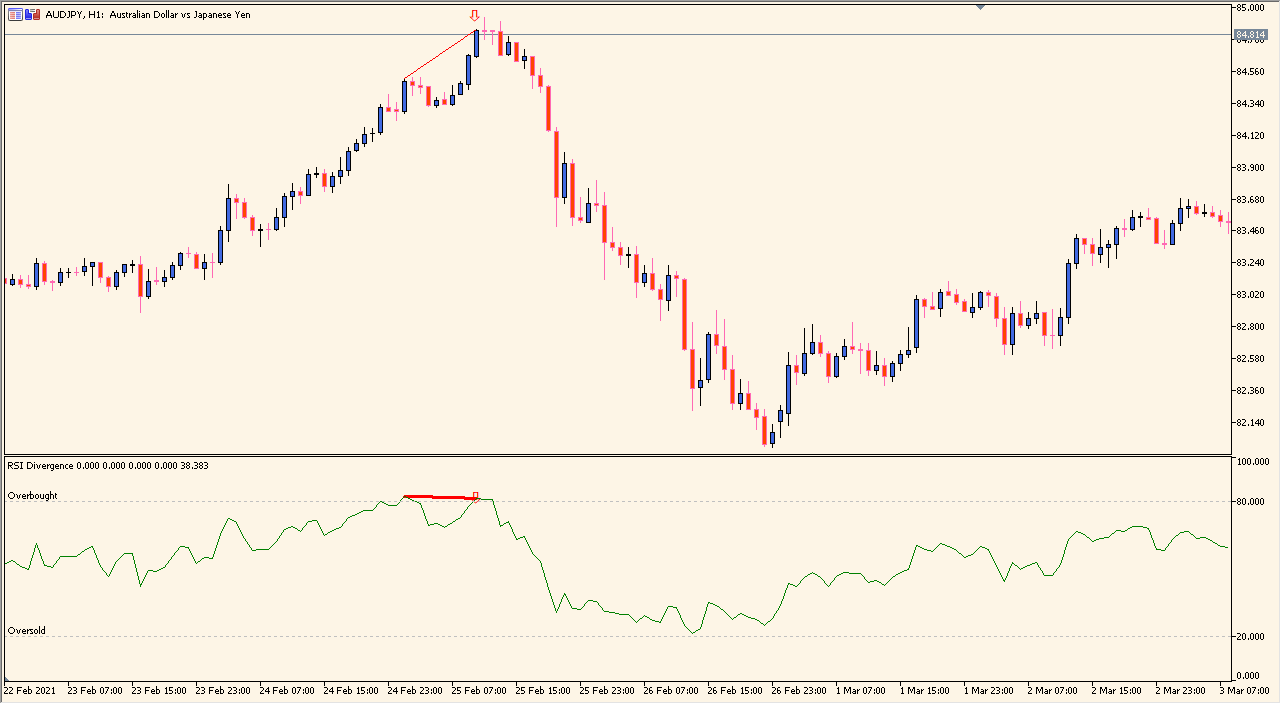
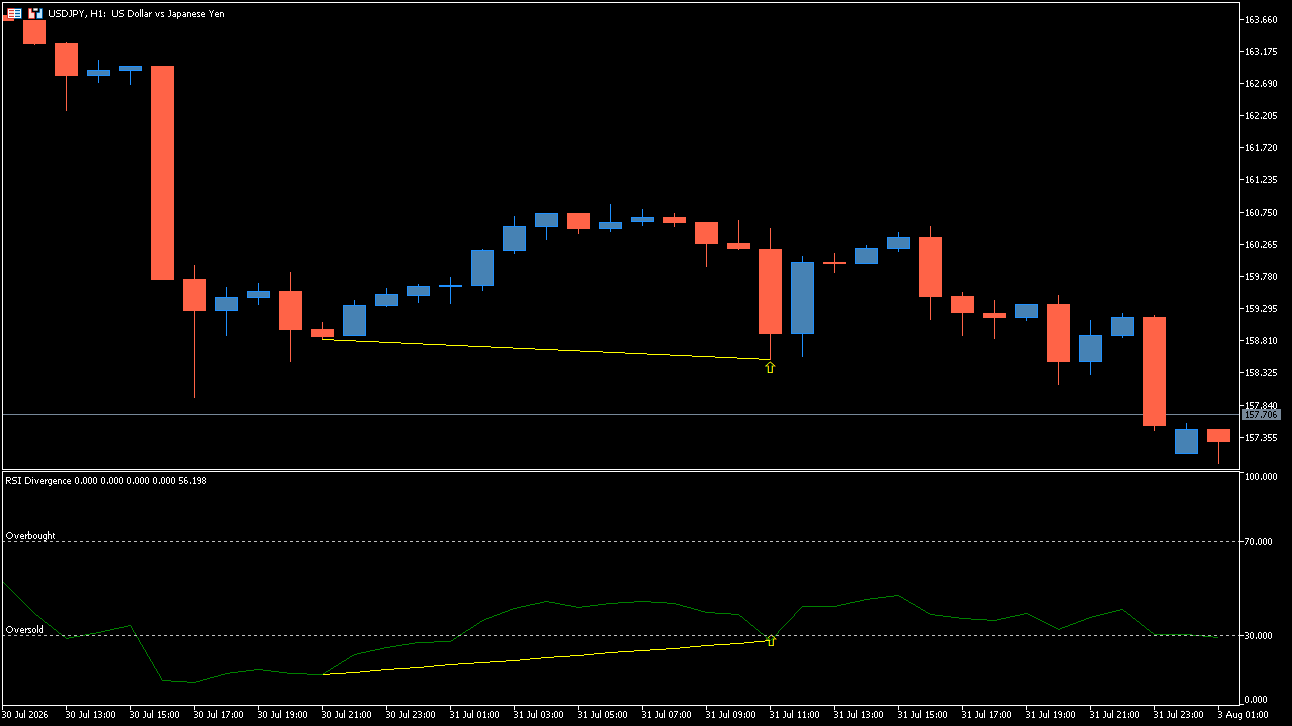
RSI Divergence Indicator for MT5 draws divergence lines between price movement and the Relative Strength Index (RSI). It can display regular, hidden, or both divergence types according to the selected input.
The lines organize a visual comparison between swing behavior and the oscillator. They are chart annotations for review and do not by themselves establish a reversal, direction, or trading instruction.
How to use RSI Divergence Indicator
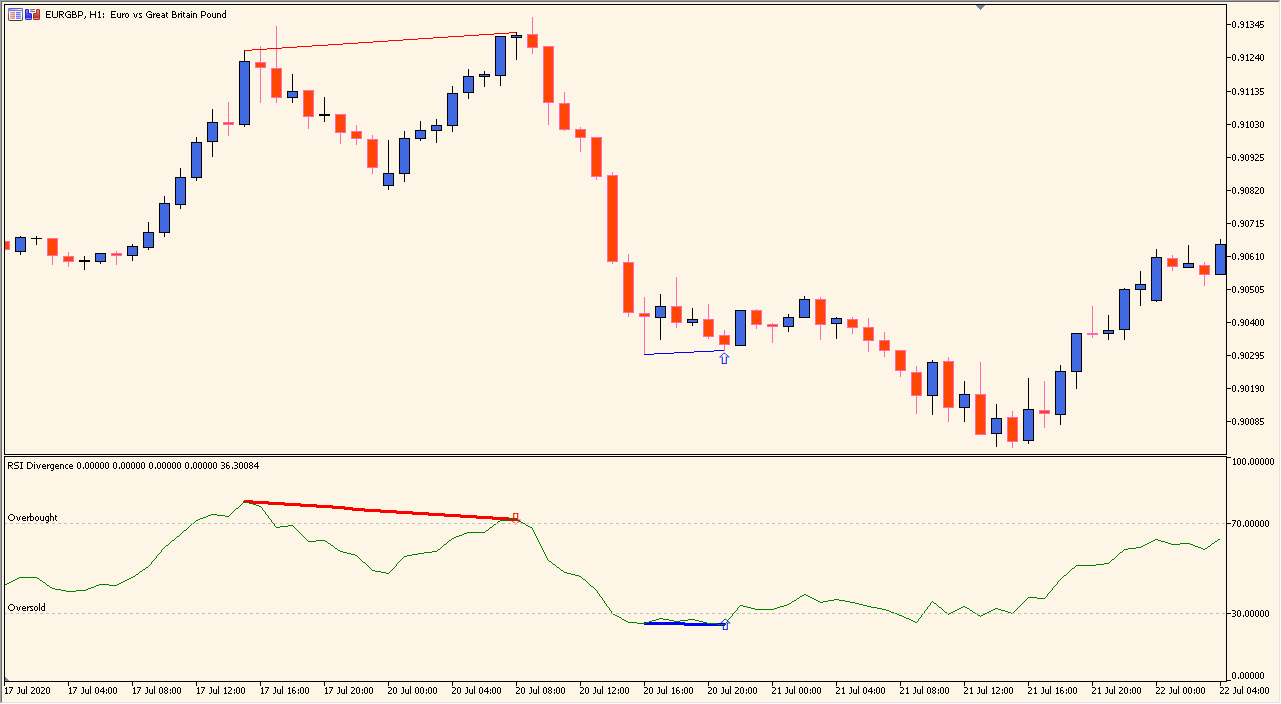
Compare the marked RSI divergences and hidden divergences with the corresponding price swings:
- Locate the price and RSI points used by each displayed divergence mark.
- Compare the mark with nearby swing highs and lows instead of treating the annotation as a standalone decision.
- Adjust Overbought and Oversold to change which RSI extremes are considered by the indicator.
- Use settings appropriate to the symbol and timeframe because changing the thresholds also changes how many marks are displayed.
Where it helps
Regular and hidden divergence lines can be reviewed without manual drawing, the RSI relationship stays visible on the price chart, and existing Inputs control which references are shown.
MT5 Indicator Parameters
The table below lists the available MT5 indicator parameters. You can customize these options in the MetaTrader Inputs dialog to match your trading preferences.
| Parameter | Description |
|---|---|
| RSI Period | Sets the calculation lookback period for the Relative Strength Index. Default: 14. |
| Applied Price | Selects the price field applied to RSI calculation. Default: Close price. |
| Overbought Level | Sets the overbought threshold level for divergence detection. Default: 70. |
| Oversold Level | Sets the oversold threshold level for divergence detection. Default: 30. |
| Bullish Color | Sets the display color for bullish divergence lines. Default: Blue. |
| Bearish Color | Sets the display color for bearish divergence lines. Default: Red. |
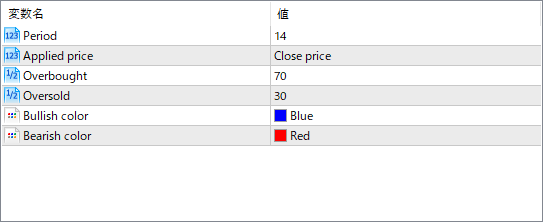
The screenshot above shows the default input parameters in the MT5 settings window.
How to Install .ex5 Indicator in MetaTrader 5
- Download the ZIP file and extract it.
- In MT5, select File → Open Data Folder.
- Open MQL5 → Indicators and copy the EX5 or MQ5 file into it.
- If the package includes library files, copy them to MQL5 → Libraries. Copy TPL files to the top-level templates folder.
- Restart MT5, find the indicator in the Navigator, and drag it onto a chart.
Test the tool on a demo account first. File contents and required folders can vary between packages.


