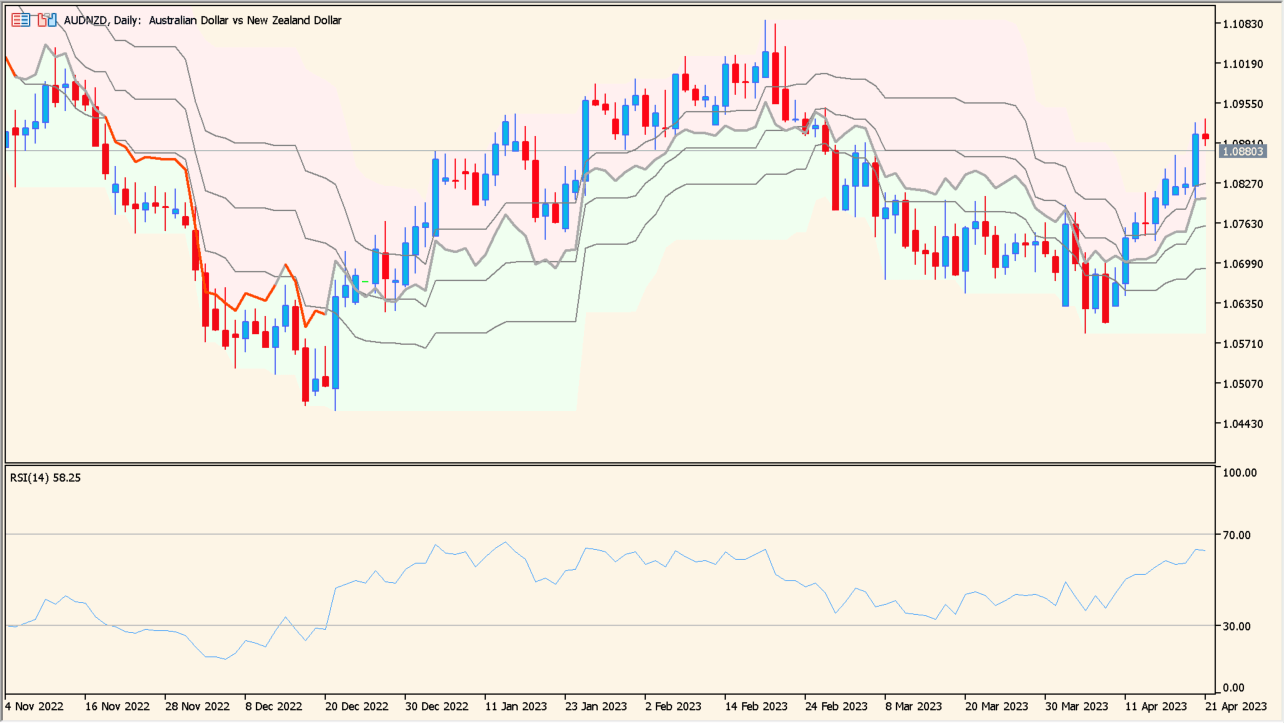
What is RSI on Chart?
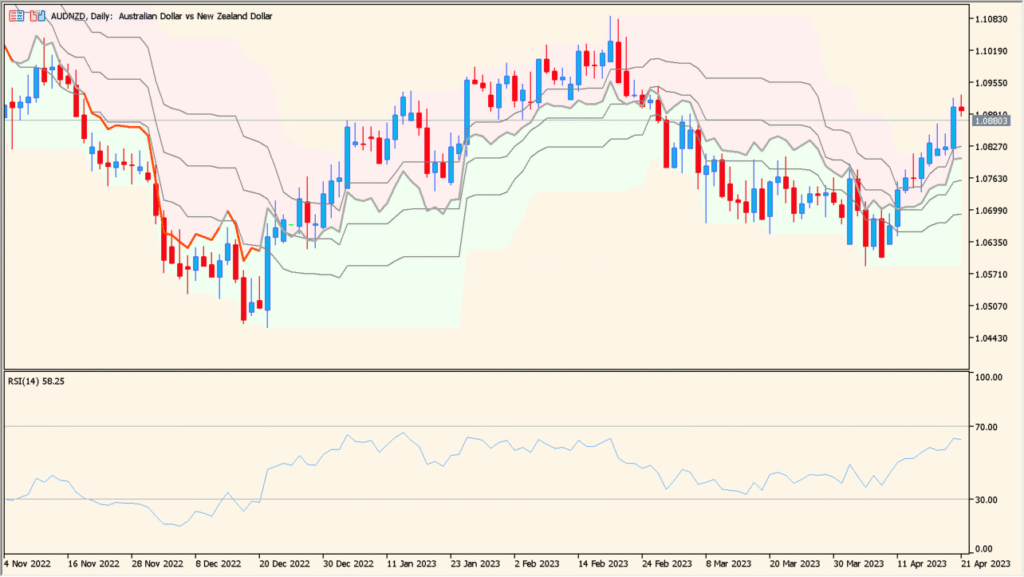
RSI on Chart is an MT5 indicator that overlays Relative Strength Index conditions directly on main chart candles.
Instead of requiring a separate subwindow, it highlights overbought and oversold price levels with custom candle colors.
How to use RSI on Chart
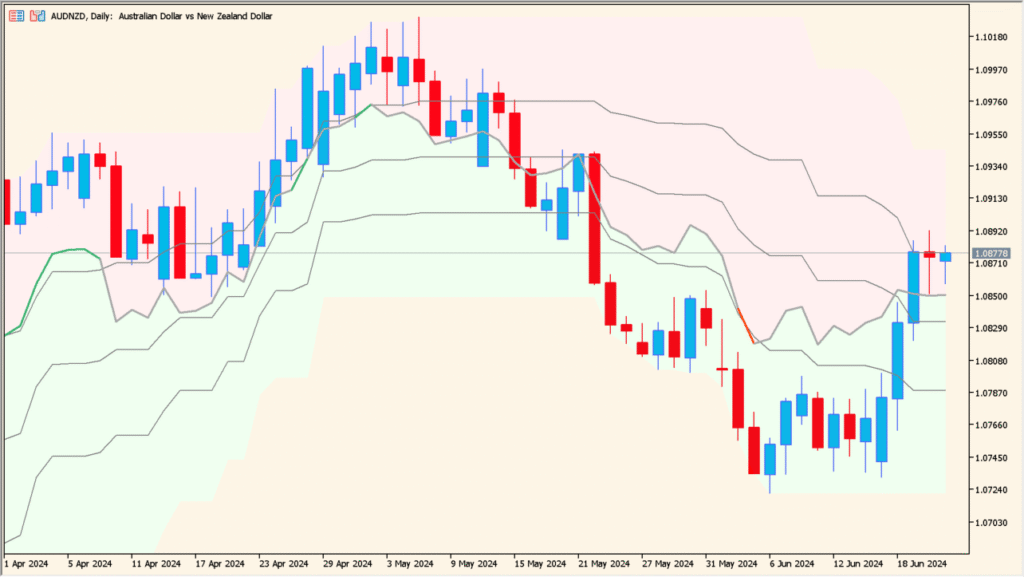
Identify potential momentum exhaustion when candles enter upper overbought or lower oversold visual zones.
Keep the chart layout clean by viewing RSI overbought and oversold states directly on price candles.
Where it helps
Visualizes RSI conditions directly on main price candles without subwindows.
Colors candles when price reaches dynamic overbought or oversold boundaries.
MT5 Indicator Parameters
The table below lists the available MT5 indicator parameters. You can customize these options in the MetaTrader Inputs dialog to match your trading preferences.
| Parameter | Description |
|---|---|
| RSI period | Defines the lookback period for calculating the Relative Strength Index. Default: 14. |
| Price | Specifies the price type applied to the RSI formula. Default: 0. |
| Highest high/lowest low period | Sets the lookback window for dynamic upper and lower boundaries. Default: 20. |
| OB level | Defines the RSI overbought threshold level. Default: 70. |
| OS level | Defines the RSI oversold threshold level. Default: 30. |
| Color changing mode | Toggles color changes when RSI enters extreme boundary zones. Default: true. |
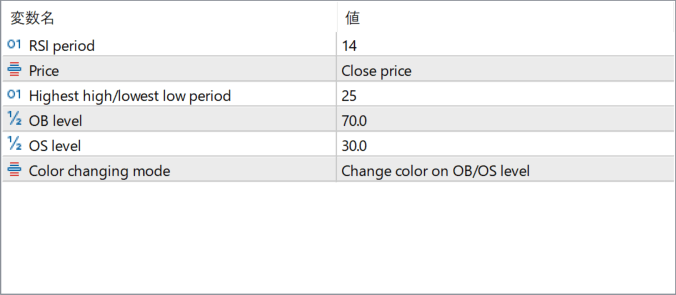
The screenshot above shows the default input parameters in the MT5 settings window.
How to Install .ex5 Indicator in MetaTrader 5
- Download the ZIP file and extract it.
- In MT5, select File → Open Data Folder.
- Open MQL5 → Indicators and copy the EX5 or MQ5 file into it.
- If the package includes library files, copy them to MQL5 → Libraries. Copy TPL files to the top-level templates folder.
- Restart MT5, find the indicator in the Navigator, and drag it onto a chart.
Test the tool on a demo account first. File contents and required folders can vary between packages.


