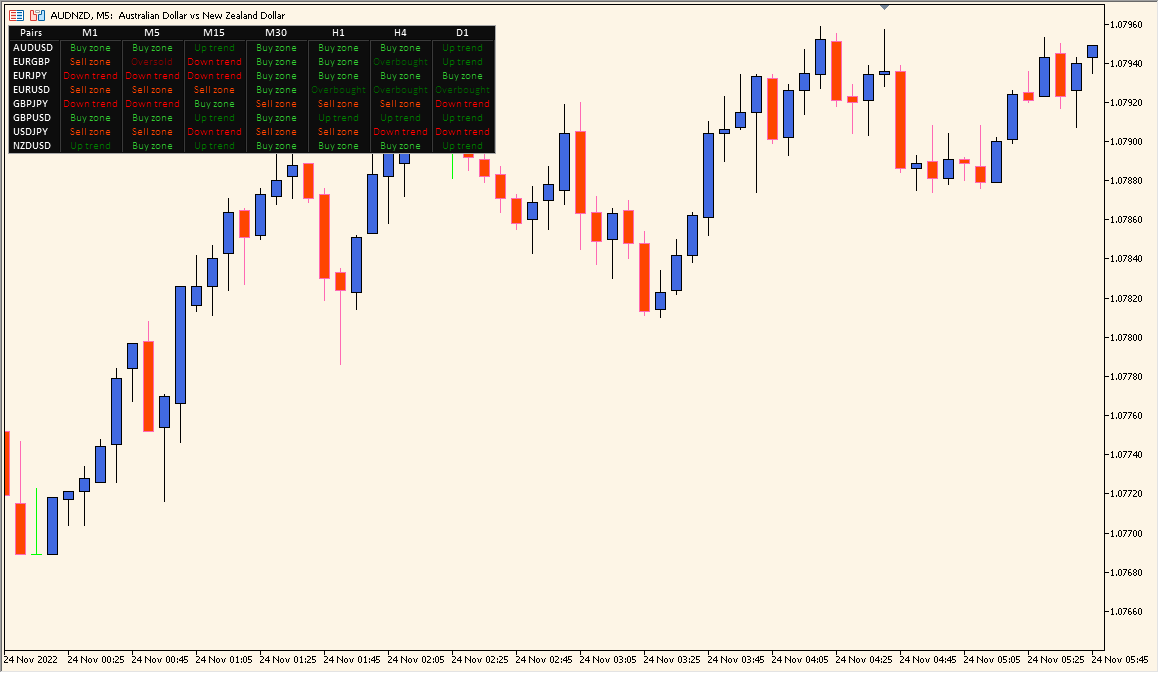
What is RSI Overview Indicator?
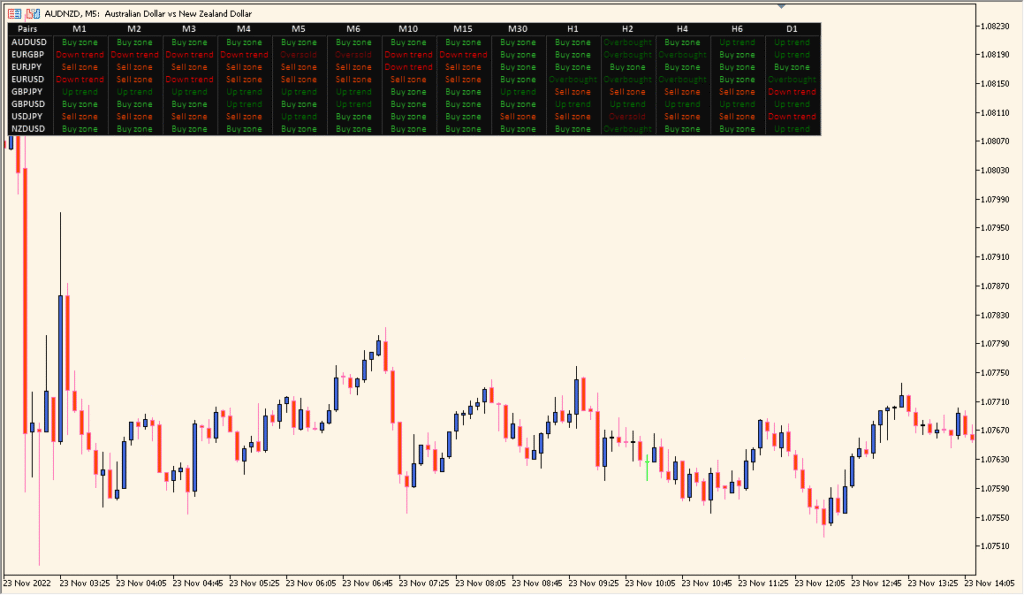
RSI Overview is an MT5 panel that displays RSI readings for selected symbols and timeframes in one compact dashboard. Symbols, periods, levels, colors, and panel layout settings control the visible comparison.
The panel helps organize relative oscillator readings without opening each chart separately. Values and colors are chart context for review rather than a directional recommendation.
How to Use It in Practice
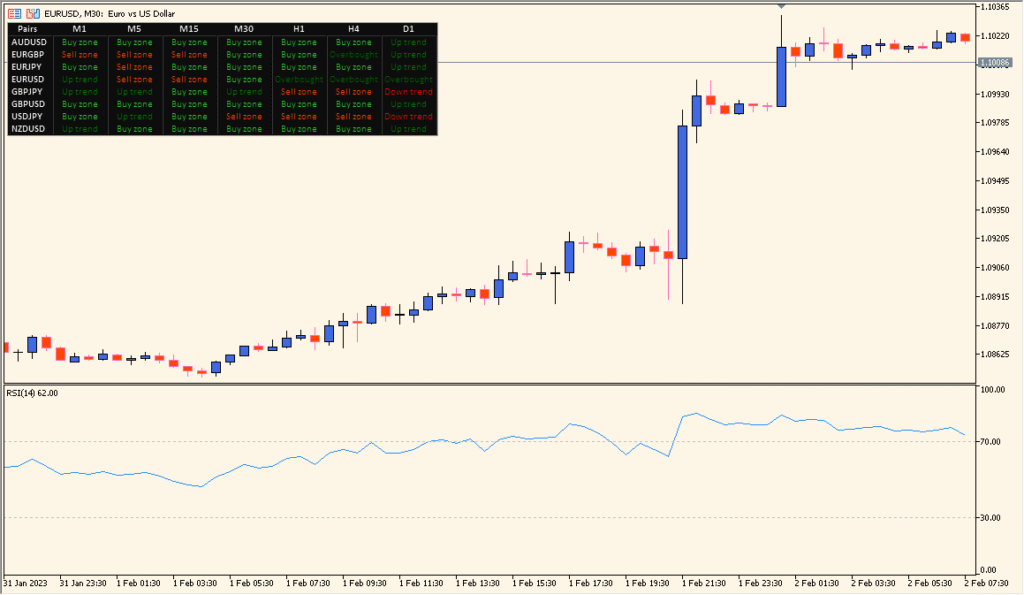
Read the top-row currency and timeframe list as a compact condition board: green and red text mark the displayed RSI zones after the SMA treatment. Its values are therefore not a direct duplicate of a plain RSI pane.
- List the symbols to inspect in the comma-separated symbol setting, then enable only the timeframe rows needed for the comparison.
- Review the green or red row states alongside their own chart histories rather than treating the board as a self-contained decision tool.
- Avoid enabling an excessive number of timeframes at once; this can increase processing load, and the text size is not adjustable.
Multiple RSI readings are grouped in one panel, cross-symbol comparison is quicker, and layout settings keep the dashboard readable.
MT5 Indicator Parameters
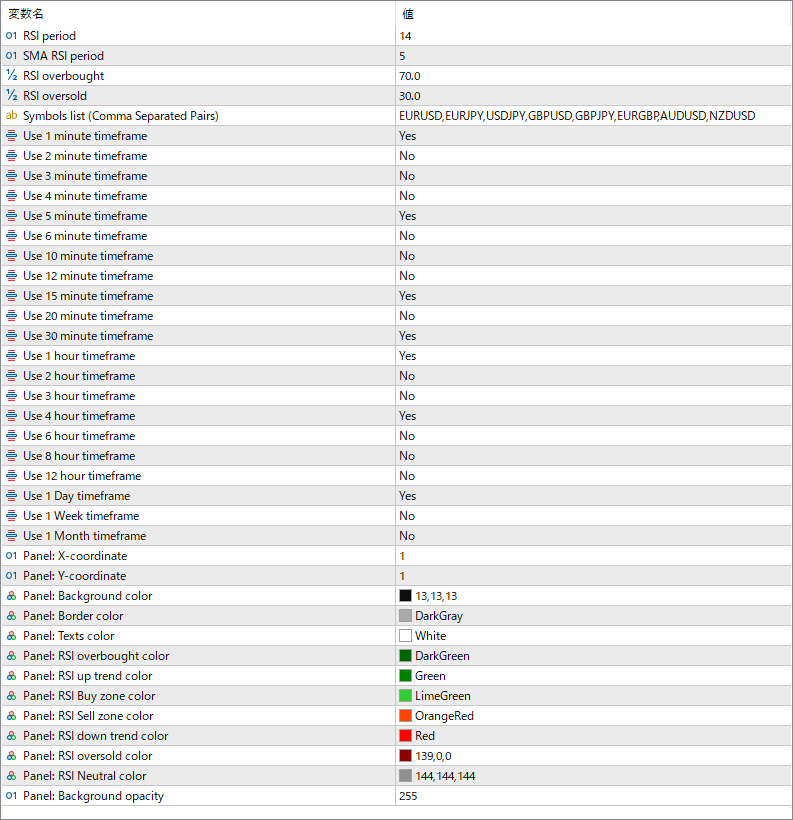
The screenshot above shows the default input parameters in the MT5 settings window.
| Parameter | Description |
|---|---|
| RSI period | Defines the number of bars used to calculate the Relative Strength Index. Adjusting this value changes how sensitive the RSI is to recent price movements. |
| SMA RSI period | Sets the period for smoothing the RSI values using a simple moving average. |
| RSI overbought | Specifies the upper threshold where the RSI is considered overbought. Typically used to identify potential sell conditions. |
| RSI oversold | Defines the lower threshold for oversold conditions, often signaling possible buy opportunities. |
| Symbols list | Lists all currency pairs to monitor, separated by commas. The indicator displays RSI data for each listed symbol. |
| Use X minute/hour/day timeframe | Enables or disables the display of specific timeframes in the dashboard. For example, enabling “Use 1 hour timeframe” shows RSI data from the H1 chart. This allows customization of the time horizon shown in the overview panel. |


