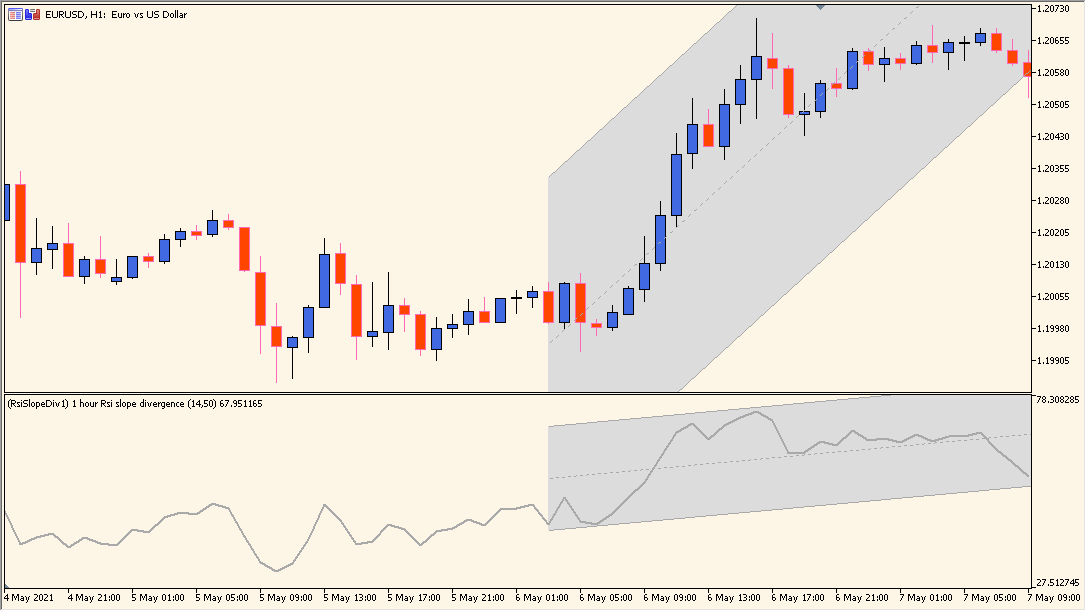
What is RSI Slope Divergence Indicator?
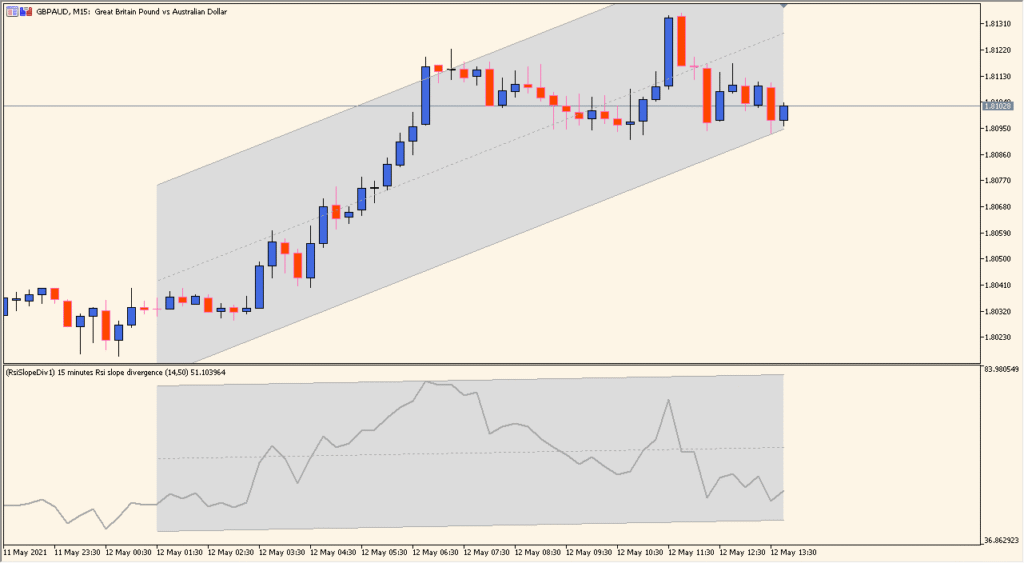
The RSI Slope Divergence Indicator MTF for MT5 plots linear-regression channels on the price chart and in the RSI window. It marks areas where the price and RSI slopes move in different directions.
Timeframe, RSI period, price source, channel width, line colors, and line styles can be adjusted in the existing settings. The display is intended for reviewing momentum and price structure together.
How to Use It in Practice
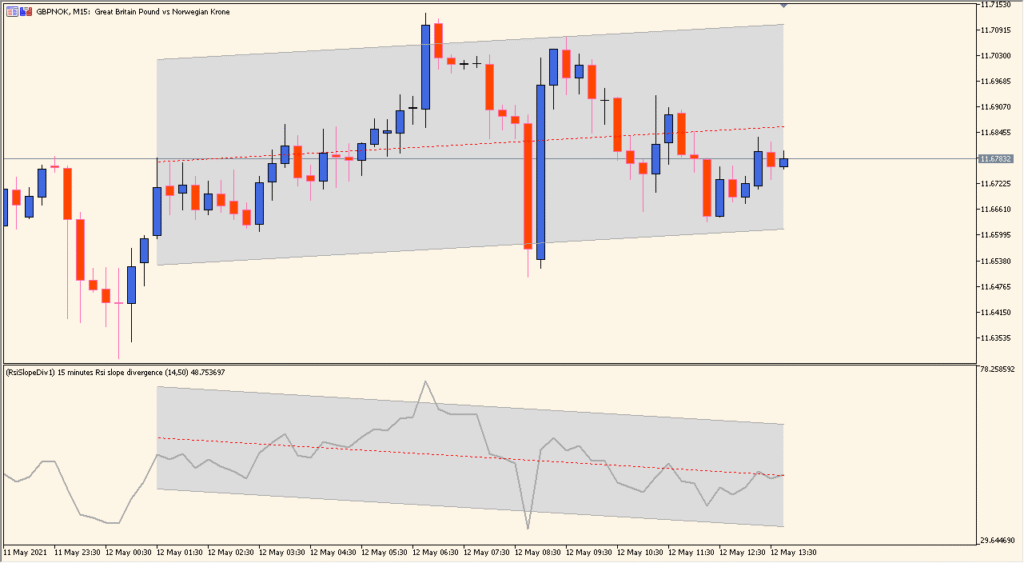
Compare the two regression-based center lines first: gray marks matching price and RSI directions, while red marks different directions. This is a regression comparison, not a simple line drawn from one pair of peaks or lows.
- Review the direction of the price and RSI regression lines together before examining their channel boundaries.
- Use Period and Linear regression period to compare the amount of price history included in the calculation; the red display is not timing information.
- Keep the calculation timeframe and channel presentation clear enough to distinguish a different-direction state from ordinary slope changes.
Price and RSI channels are available in one display, slope differences are marked visually, and multi-timeframe and styling controls support different chart views.
MT5 Indicator Parameters
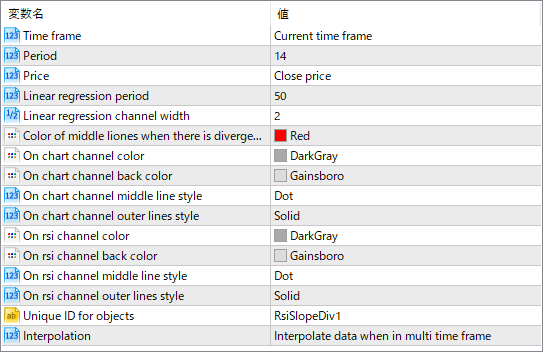
The screenshot above shows the default input parameters in the MT5 settings window.
| Parameter | Description |
|---|---|
| Time frame | Sets the timeframe used for calculation. Can be the current chart timeframe or a higher/lower one for multi-timeframe analysis. |
| Period | Number of periods used to calculate the RSI. |
| Price | Selects the price type (e.g., close price) used for calculations. |
| Linear regression period | Defines the number of bars used to build the linear regression channel. |
| Linear regression channel width | Controls the distance from the central regression line to the channel boundaries. |
| Color of middle lines when there is divergence | Sets the color of the middle line in the channel when a divergence signal is detected. |
| On chart channel color | Defines the color of the price chart channel lines. |
| On chart channel back color | Sets the background color of the price chart channel area. |
| On chart channel middle line style | Specifies the line style (e.g., dotted) for the channel’s middle line on the chart. |
| On chart channel outer lines style | Specifies the line style for the channel’s outer boundaries on the chart. |
| On RSI channel color | Defines the color of the RSI channel lines. |
| On RSI channel back color | Sets the background color of the RSI channel area. |
| On RSI channel middle line style | Specifies the line style for the RSI channel’s middle line. |
| On RSI channel outer lines style | Specifies the line style for the RSI channel’s outer boundaries. |
| Unique ID for objects | Identifier used to manage and distinguish indicator objects on the chart. |
| Interpolation | Determines whether data is interpolated when using multi-timeframe mode. |


