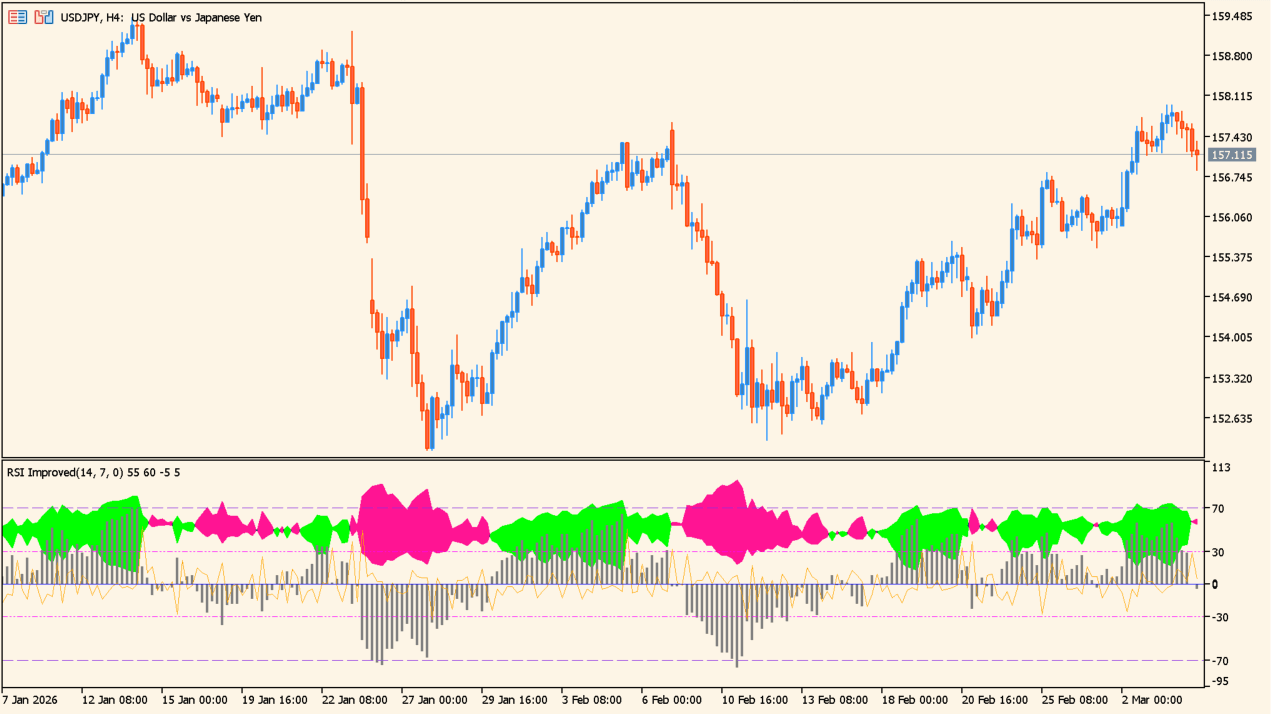
What is RSIimproved?
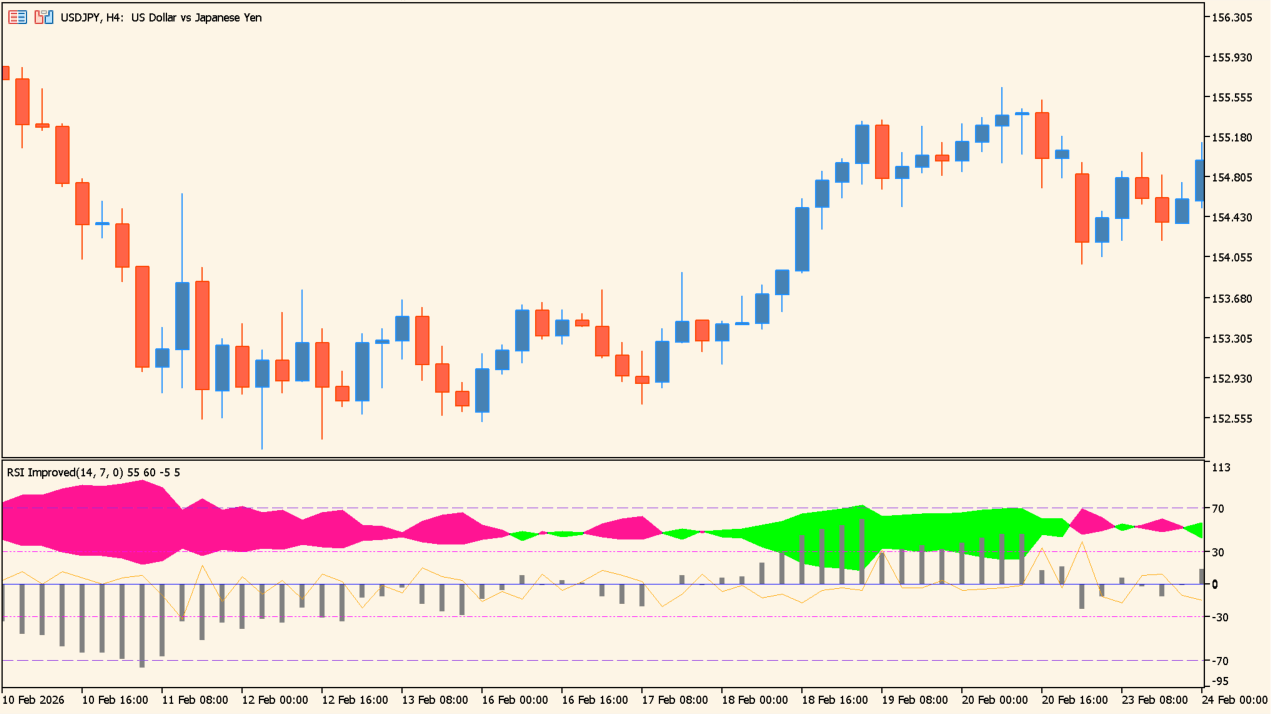
RSIimproved is built on RSI but pairs the standard reading with a shorter-period one, showing the difference as a histogram and colored areas.
Where RSI is accelerating upward the display takes a bullish color and where it is accelerating downward a bearish one, so a change in strength is easier to read than on a plain RSI line.
How to use RSIimproved
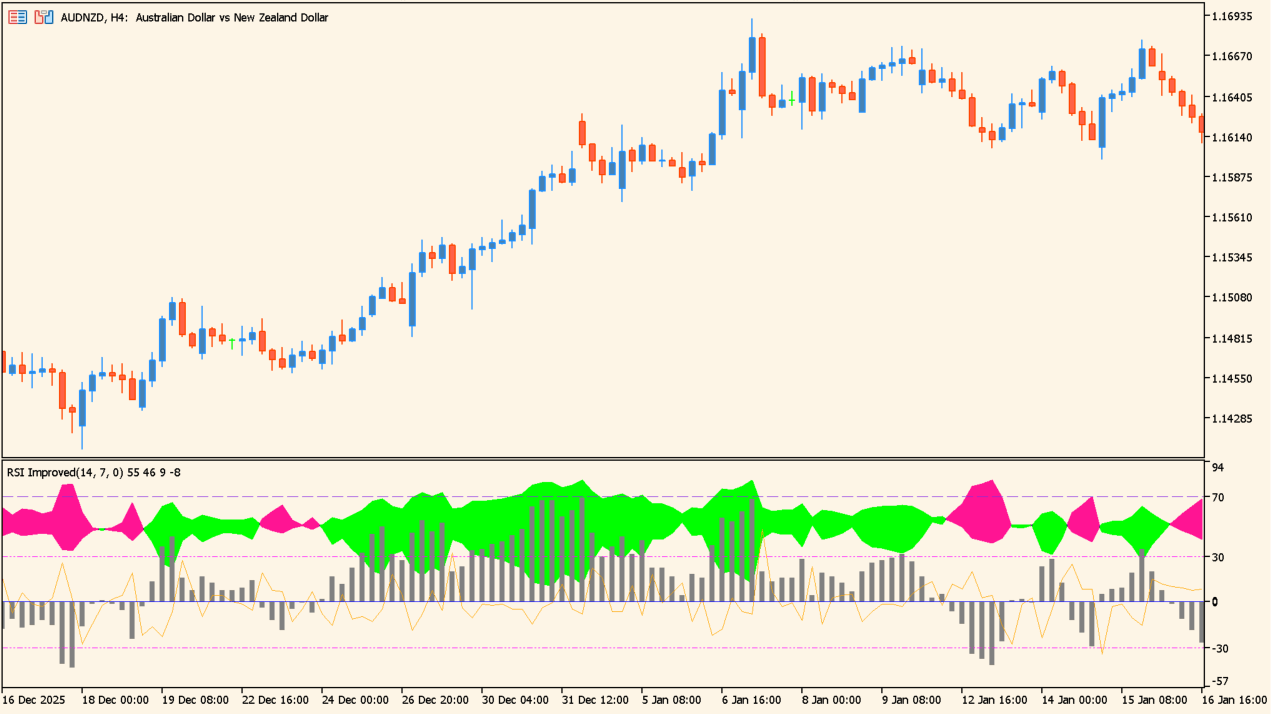
Use the familiar levels as your reference: around 70 is overbought territory and around 30 is oversold. Read the color alongside them, because the color is telling you whether momentum is accelerating rather than simply where the reading sits.
Watch for a discrepancy between price and the indicator. If price posts a new high while the RSI reading steps lower, that divergence is material for looking at the early part of a reversal. In a trending market the display serves for timing pullback and rally entries; in a range it serves the opposite purpose, for fading the extremes.
Where it helps
A plain RSI tells you where the reading is. The coloring here tells you whether it is speeding up or slowing down, which is the part that usually matters at a turn.
With the histogram alongside the line, price making a new high while the reading steps lower stands out instead of needing to be measured.
The same display supports pullback entries while a trend runs and counter-trend entries when the market is ranging.
MT5 Indicator Parameters
The table below lists the available MT5 indicator parameters. You can customize these options in the MetaTrader Inputs dialog to match your trading preferences.
| Parameter | Description |
|---|---|
| Period for original RSI | Sets the calculation period for the standard RSI. Smaller values make it respond faster, while larger values produce a smoother reading. |
| Period for rotated RSI | Sets the calculation period for the short-term RSI. Its difference from the original RSI is used to visualize momentum. |
| shift | Sets the horizontal shift of the indicator display. |
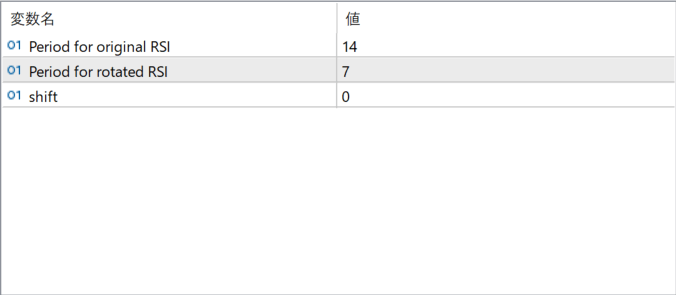
The screenshot above shows the default input parameters in the MT5 settings window.
How to Install .ex5 Indicator in MetaTrader 5
- Download the ZIP file and extract it.
- In MT5, select File → Open Data Folder.
- Open MQL5 → Indicators and copy the EX5 or MQ5 file into it.
- If the package includes library files, copy them to MQL5 → Libraries. Copy TPL files to the top-level templates folder.
- Restart MT5, find the indicator in the Navigator, and drag it onto a chart.
Test the tool on a demo account first. File contents and required folders can vary between packages.


