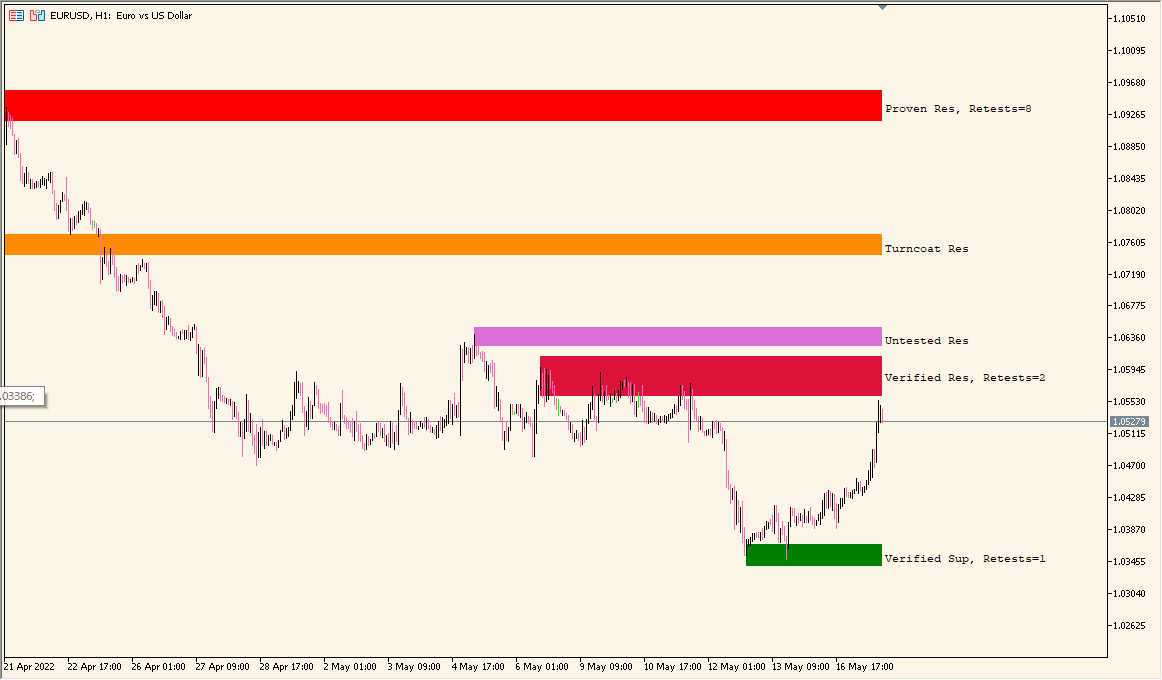
What is Shved Supply and Demand Indicator?
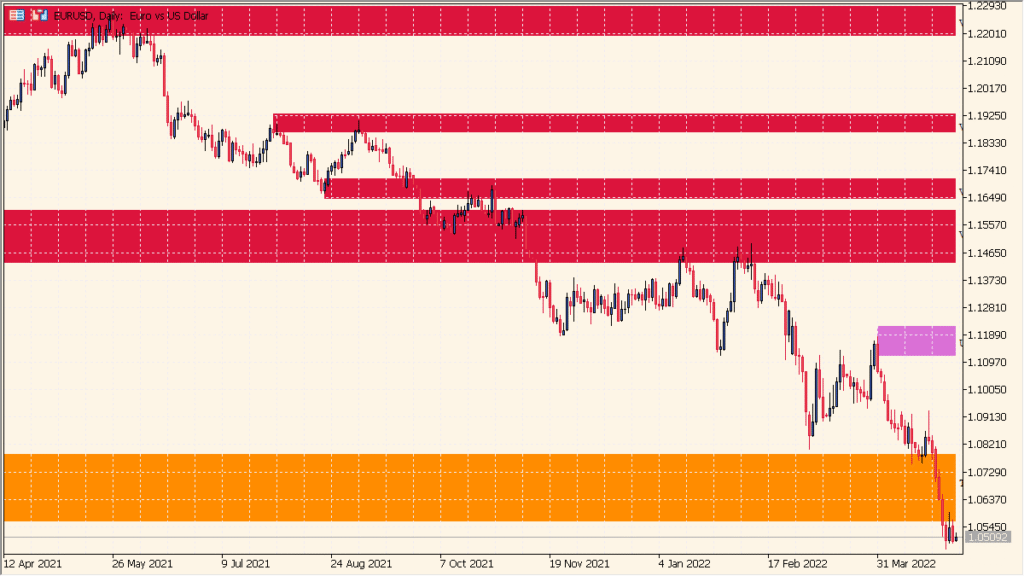
Shved Supply and Demand v1.4 is an MT5 chart indicator that marks labeled supply and demand zones from detected chart structure. Lookback, zone width, extension, colors, labels, and history settings shape the display.
The zones organize previously marked areas so readers can compare them with current price behavior and nearby swings. They are displayed chart references and do not establish a reaction or reversal.
How to Use It in Practice
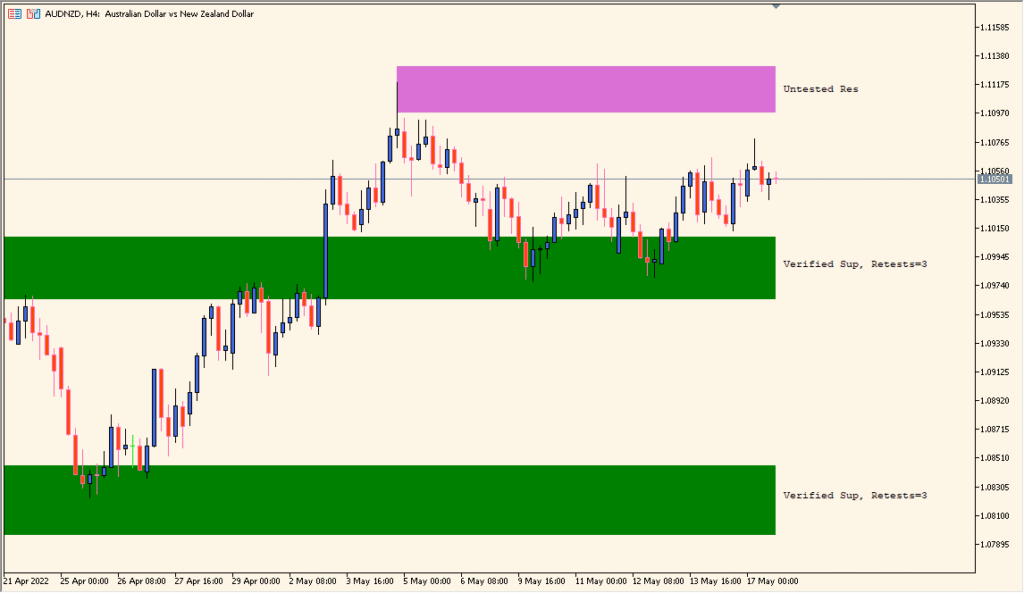
The chart separates support zones in green shades and resistance zones in red shades. A darker shade denotes a stronger displayed zone; OliveDrab and DarkOrange identify zones that have already been broken.
- Compare the green and red zones with the chart’s highs, lows, and nearby candle structure, while keeping their shade strength distinct.
- Set Show Weak zones to true when the lighter weak zones are required; they are hidden in the default display.
- Change the OliveDrab or DarkOrange colors, or set Show Broken zones to false, when previously broken zones make the chart harder to read.
Detected areas are labeled and extended automatically, display controls help manage chart density, and history settings support comparison.
MT5 Indicator Parameters
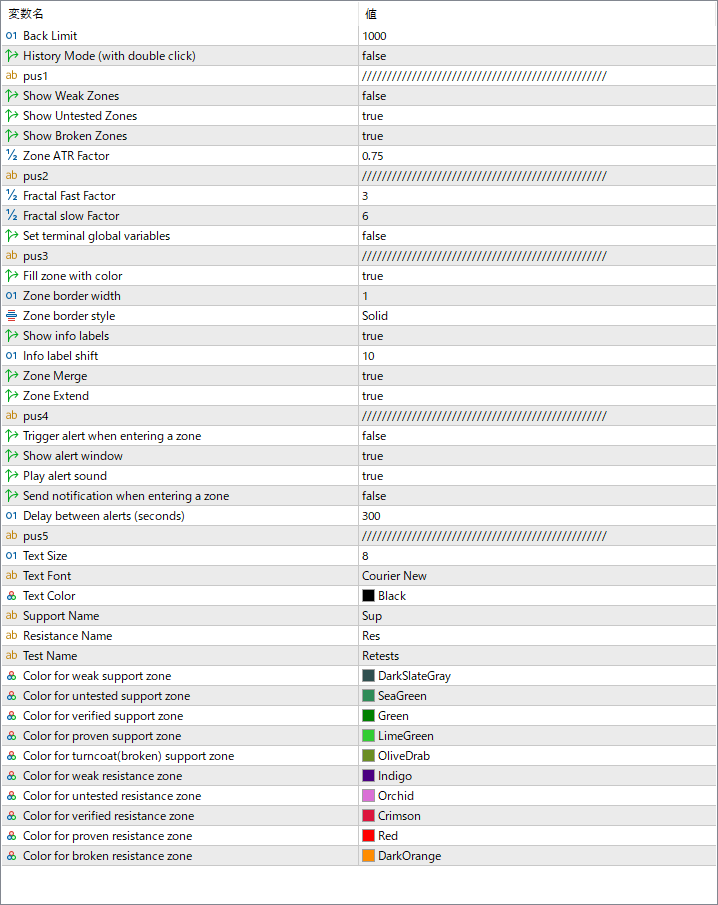
The screenshot above shows the default input parameters in the MT5 settings window.
| Parameter | Description |
|---|---|
| Back Limit | Sets how many historical bars the indicator analyzes to detect zones. Increasing the number may reveal more past zones but can slow down processing. |
| History Mode (with double click) | Allows manual review of historical zones by double-clicking on the chart to toggle through past data. |
| Show Weak Zones | Displays weaker zones that have already been tested multiple times. |
| Show Untested Zones | Displays zones that have not yet been retested by price. |
| Show Broken Zones | Shows zones that have already failed, helping traders visualize changes in market structure. |
| Zone ATR Factor | Defines how the zone height is adjusted based on market volatility. A higher factor expands the zone width relative to the ATR (Average True Range). |
| Fractal Fast Factor / Fractal Slow Factor | Control the sensitivity of the fractal algorithm used for detecting significant swing highs and lows that define zones. |
| Fill zone with color | Enables or disables background coloring of zones for easier visualization. |
| Zone border width / style | Adjusts the thickness and line style of the zone borders for better chart clarity. |
| Show info labels | Displays labels indicating whether the zone is verified, retested, or broken, along with retest counts. |
| Zone Merge | Merges nearby overlapping zones into one larger zone to reduce clutter. |
| Trigger alert when entering a zone | Activates alerts when price enters a marked supply or demand area. |
| Play alert sound | Plays an audible sound when an alert condition is met. |
| Send notification when entering a zone | Sends a push notification to your connected device when the price reaches a zone. |
| Delay between alerts (seconds) | Specifies how long to wait before triggering the next alert to prevent excessive notifications. |


