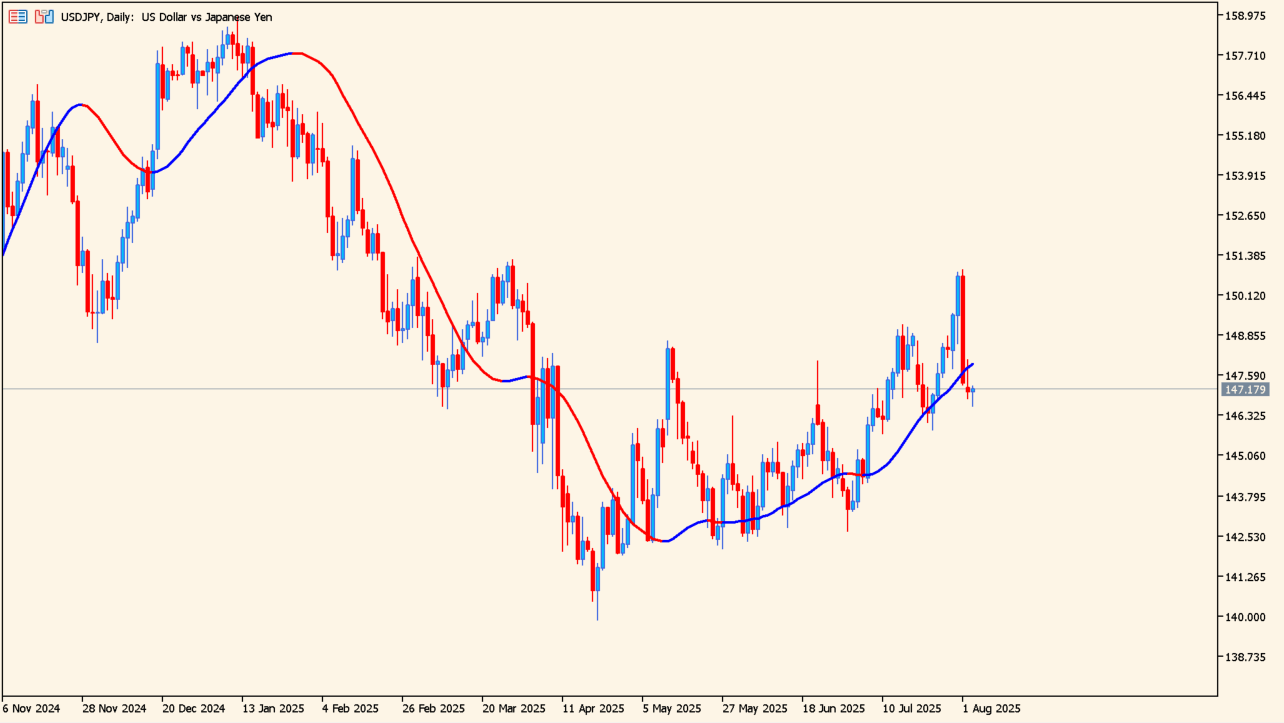
What is Slope Direction Line?
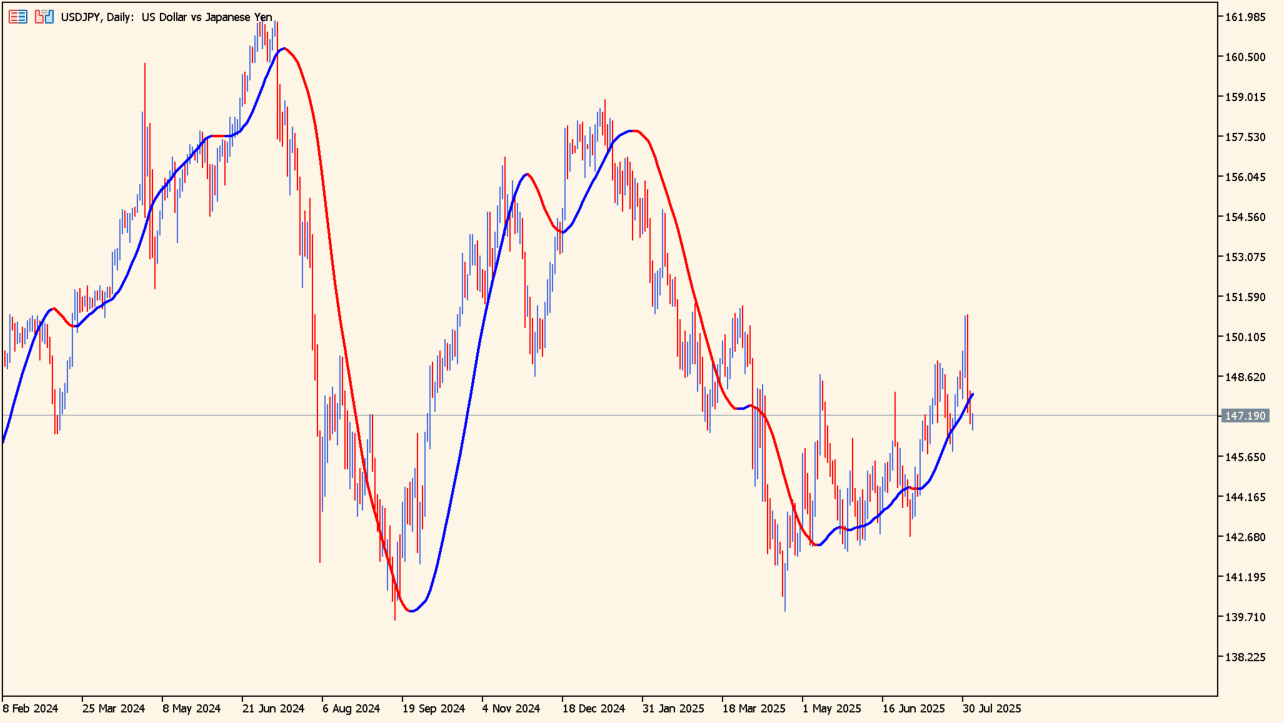
Slope Direction Line is an MT5 moving-average display based on the selected method and applied price. The plotted-line color changes as the calculated slope changes.
The display keeps the average and its current slope visible on the chart. A color change is a calculation state, so review it together with price structure.
How to use Slope Direction Line
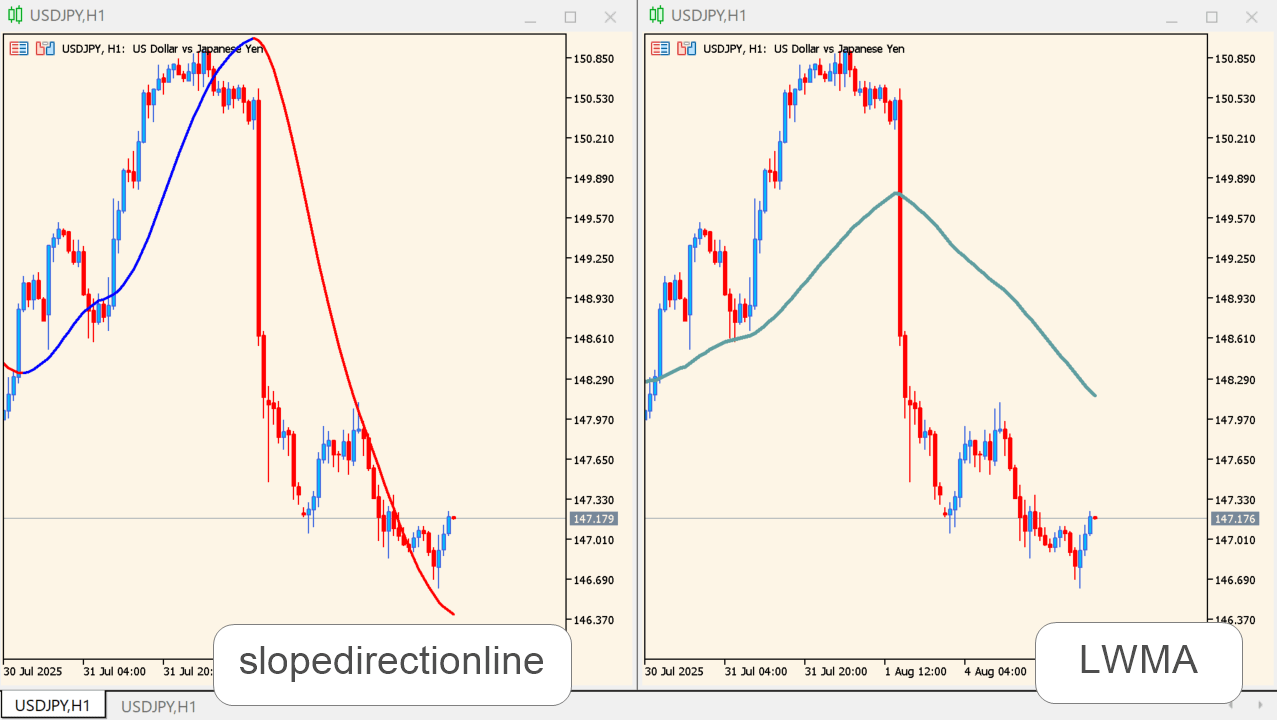
Compare the line slope and price position with recent completed candles. Set a period appropriate to the chart being reviewed before enabling any optional notifications.
Method, Apply to, and Shift control the line calculation and placement. Alert, Mail, and Sound control the three available notifications.
Where it helps
The display changes line color as the calculated slope changes.
Period, method, applied price, and shift are all exposed as Inputs.
Alert, mail, and sound switches are available separately.
MT5 Indicator Parameters
The table below lists the available MT5 indicator parameters. You can customize these options in the MetaTrader Inputs dialog to match your trading preferences.
| Parameter | Description |
|---|---|
| Period | Sets the moving-average period. Default: 80. |
| Method | Selects the moving-average method. Default: Linear weighted. |
| Apply to | Selects the price source used by the calculation. Default: Close price. |
| Shift | Sets the plotted-line shift. Default: 0. |
| Alert | Enables or disables alerts. Default: true. |
| Enables or disables email notifications. Default: true. | |
| Sound | Enables or disables sound notifications. Default: true. |
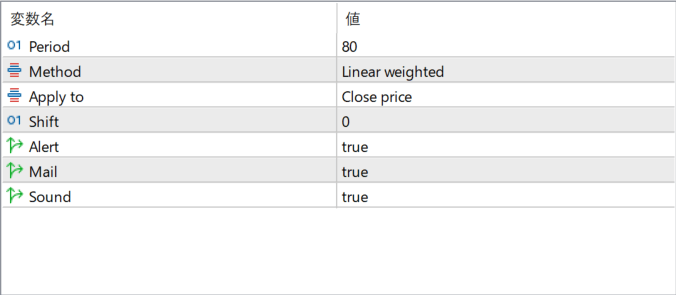
The screenshot above shows the default input parameters in the MT5 settings window.
How to Install .ex5 Indicator in MetaTrader 5
- Download the ZIP file and extract it.
- In MT5, select File → Open Data Folder.
- Open MQL5 → Indicators and copy the EX5 or MQ5 file into it.
- If the package includes library files, copy them to MQL5 → Libraries. Copy TPL files to the top-level templates folder.
- Restart MT5, find the indicator in the Navigator, and drag it onto a chart.
Test the tool on a demo account first. File contents and required folders can vary between packages.


