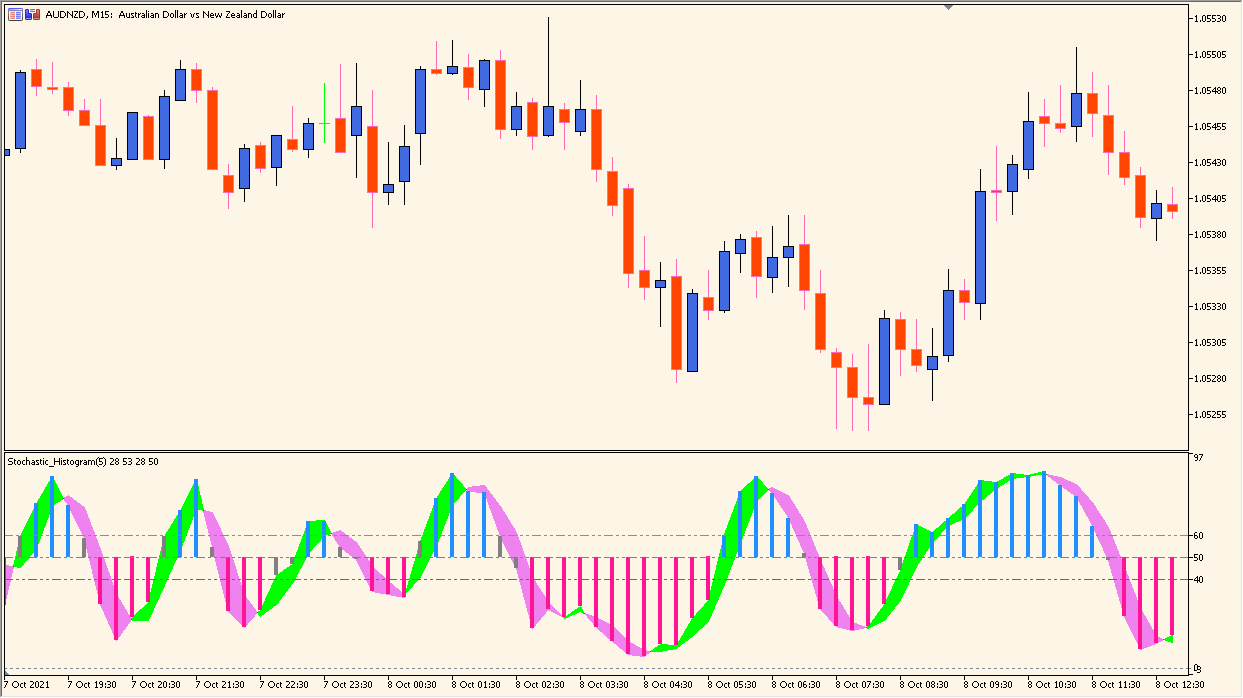
What is Stochastic Histogram Indicator?
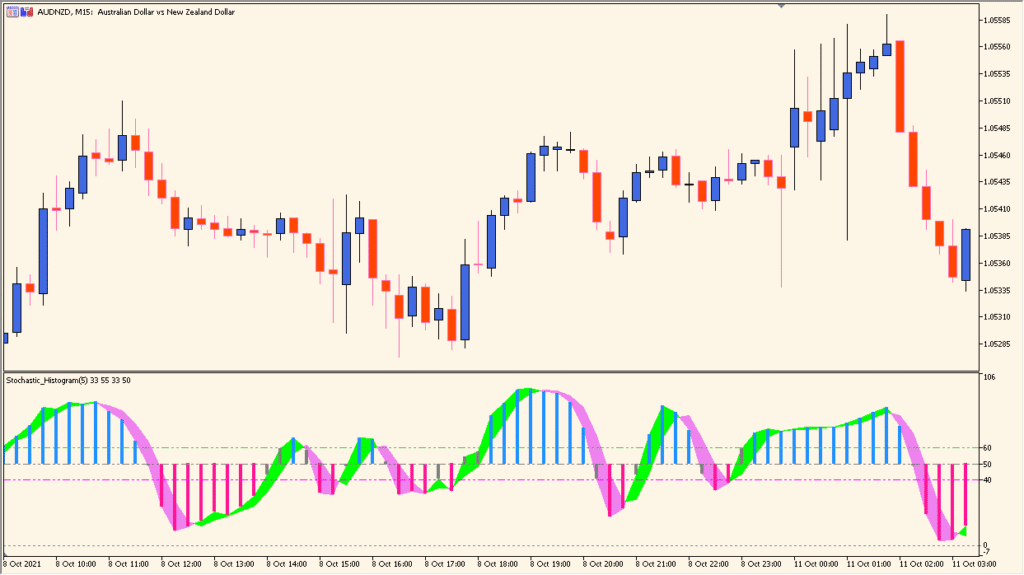
Stochastic Histogram is an MT5 subwindow indicator that displays the difference between Stochastic %K and %D readings as a color-coded histogram. Periods, smoothing, levels, colors, and display settings shape the pane.
The bars provide visual context for comparing changing oscillator distance and range. They are chart references and do not establish that an extreme will turn or continue.
How to Use It in Practice
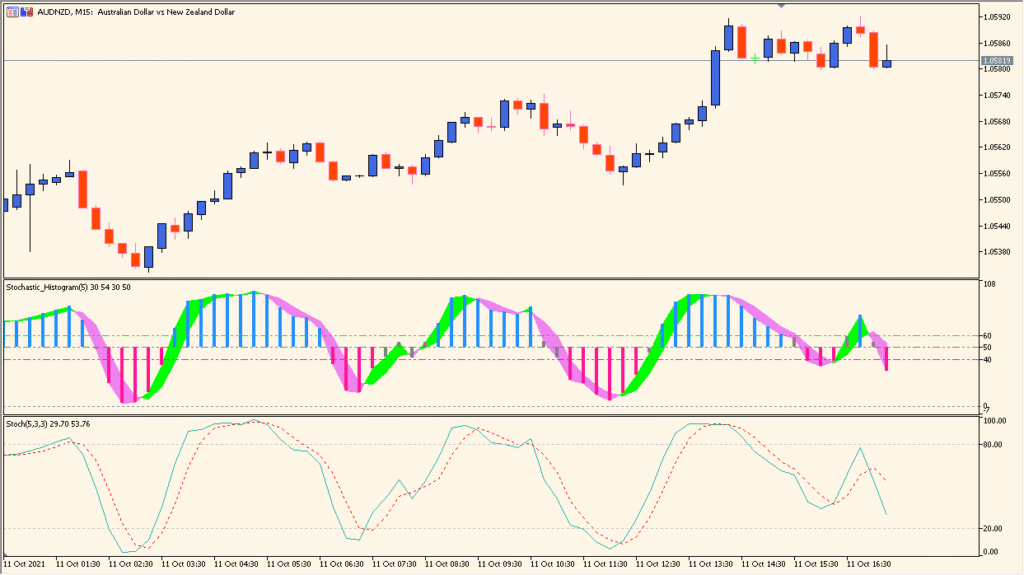
Stochastic Histogram turns the Stochastic reading into bars and fills the space between KPeriod and DPeriod in green and pink. Its calculation is the same as a standard Stochastic display, but the bar and fill treatment is the visual difference.
- Read the histogram together with the green and pink fill between KPeriod and DPeriod, then compare it with a standard Stochastic pane if needed.
- Set HighLevel and LowLevel to change the horizontal reference lines; the defaults are 60 and 40, compared with the standard Stochastic’s 80 and 20.
- Increase Shift to move the histogram right, or set a negative value to move it left.
The Stochastic difference is easy to scan as bars, color separation supports comparison, and level settings organize the pane.
MT5 Indicator Parameters
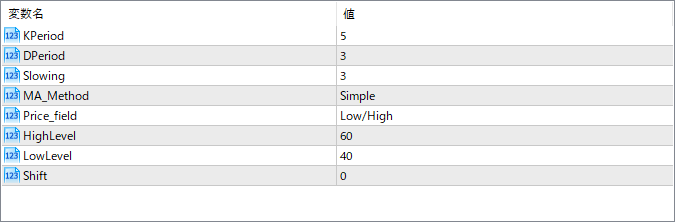
The screenshot above shows the default input parameters in the MT5 settings window.
| Parameter | Description |
|---|---|
| KPeriod | Defines the number of periods used to calculate the %K line. Shorter values make the indicator more responsive, while longer ones smooth out fluctuations. |
| DPeriod | Specifies the smoothing period for the %D line, which is the moving average of %K. |
| Slowing | Applies additional smoothing to the %K calculation, which reduces the volatility of the plotted values. |
| MA_Method | Determines the moving average type used in the calculation (e.g., Simple, Exponential). This affects how responsive the smoothing will be. |
| Price_field | Sets which price values are used for calculations (e.g., Low/High or Close/Close). This influences how the oscillator reacts to market movements. |
| HighLevel | Defines the upper boundary level, often used as an overbought threshold where prices may start to reverse downward. |
| LowLevel | Defines the lower boundary level, representing the oversold zone where potential upward reversals might occur. |
| Shift | Moves the indicator forward or backward on the chart by a specified number of bars. Useful for visual alignment or testing. |


