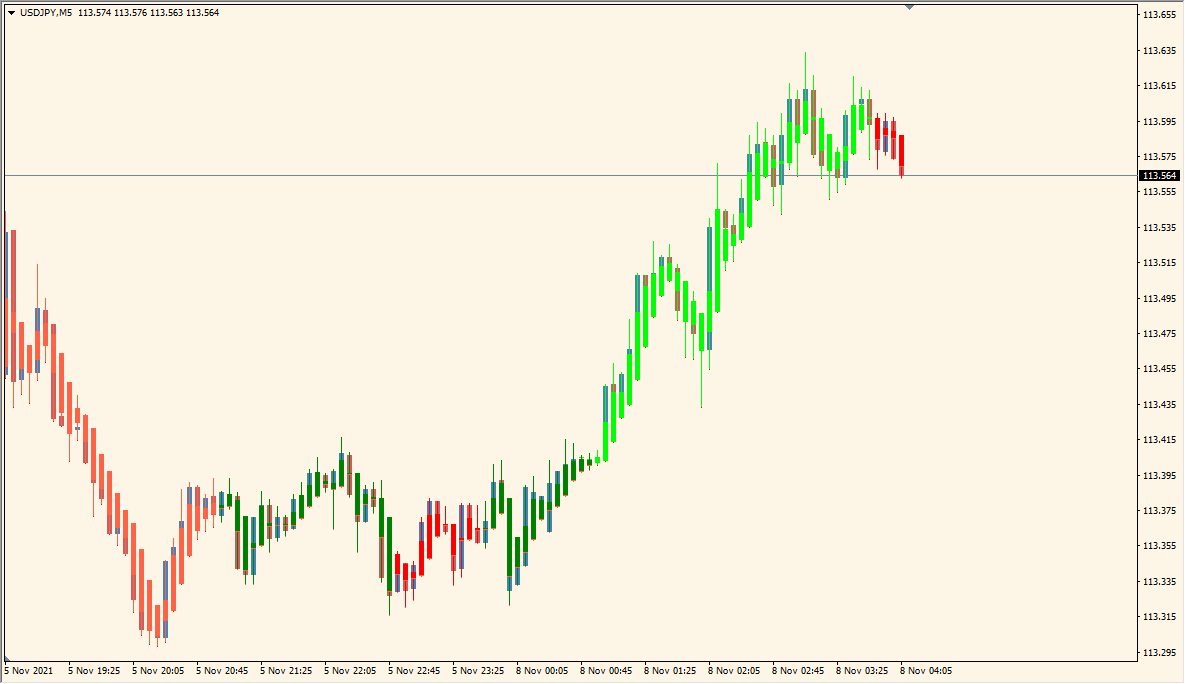
What is StochCandles Indicator?
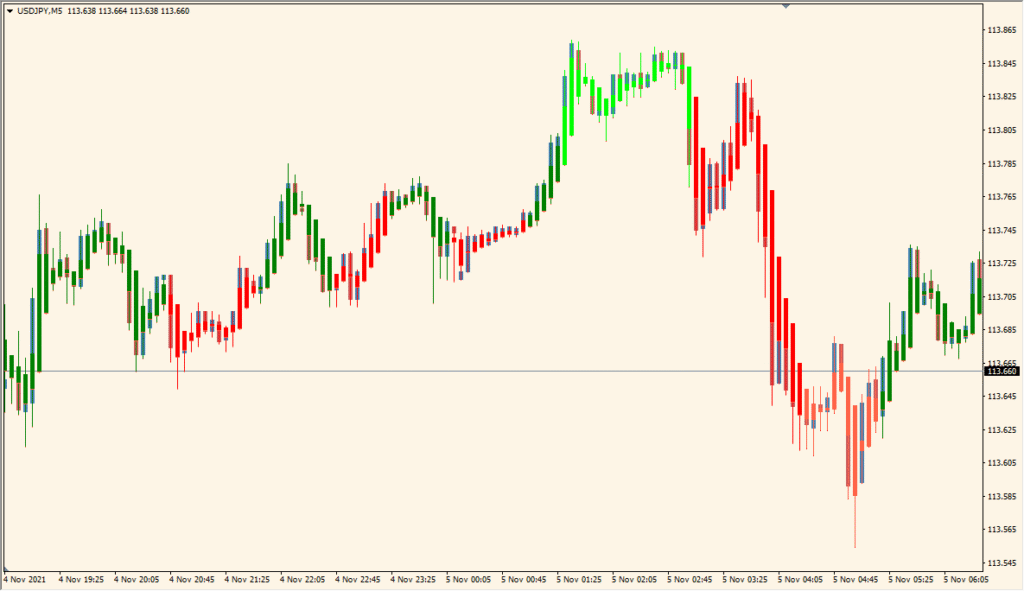
StochCandles for MT4 changes candle colors according to Stochastic readings and optional Heiken Ashi logic. The result keeps momentum context on the main chart instead of requiring a separate oscillator window.
Stoch_K, Stoch_D, Stoch_Slowing, Overbought, Oversold, color, and Heiken Ashi settings control the calculation and candle presentation. Candle colors can be compared with price structure and other chart references.
How to Use It in Practice
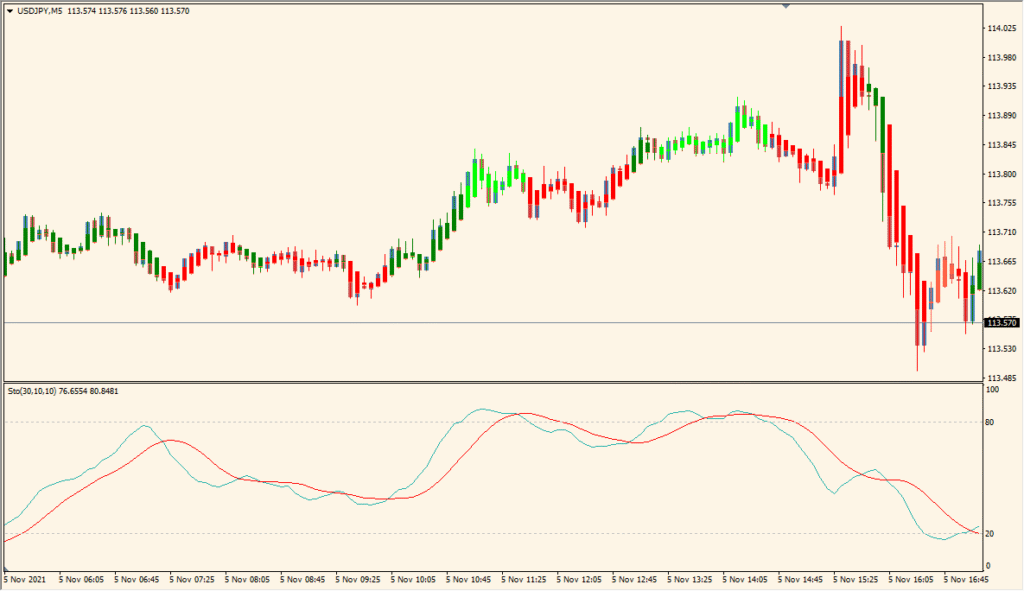
StochCandles paints the main-chart candles in four Stochastic states: light green above the upper level, green while rising between the levels, red while falling between them, and tomato below the lower level.
- Read the light-green and tomato candles against the configured upper and lower thresholds, which default to 80 and 20.
- The default Stoch_K, Stoch_D, and Stoch_Slowing values are 30, 10, and 10 rather than the common 5, 3, 3 configuration; adjust them deliberately when comparing responsiveness.
- Set HeikenAshi to false when the additional Heiken Ashi candles obscure the ordinary chart candles.
- Keep the four candle colors on the main chart rather than adding a separate Stochastic subwindow when that layout is easier to read.
Stochastic context is shown through chart candles, Heiken Ashi mode is available, and periods, thresholds, and colors can be adjusted without adding a separate panel.
MT4 Indicator Parameters
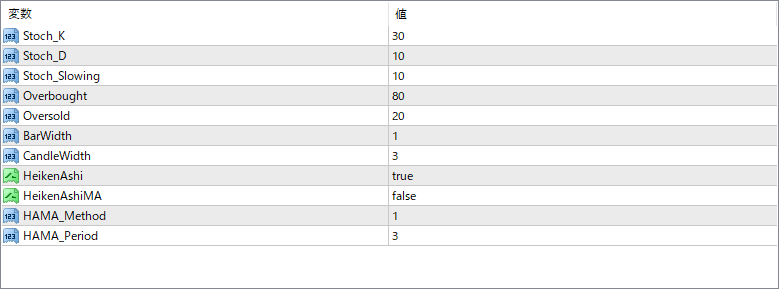
The screenshot above shows the default input parameters in the MT4 settings window.
| Parameter | Description |
|---|---|
| Stoch_K | Defines the %K period for the Stochastic calculation, controlling how reactive the indicator is to price movement. |
| Stoch_D | Sets the smoothing period for the %D line of the Stochastic. Affects the smoothness of signals. |
| Stoch_Slowing | Applies an additional slowing factor to reduce choppiness in the Stochastic output. |
| Overbought | Specifies the upper threshold where prices are considered overbought. Candle colors may change when price crosses this level. |
| Oversold | Specifies the lower threshold where prices are considered oversold. Candle colors may reflect potential reversal areas. |
| BarWidth | Controls the thickness of the candle outlines for better visibility. |
| CandleWidth | Adjusts the body width of each candle bar drawn on the chart. |
| HeikenAshi | Enables or disables Heiken Ashi smoothing for the candle drawing logic. |
| HeikenAshiMA | Option to apply a moving average to the Heiken Ashi data for additional smoothing effect. |
| HAMA_Method | Sets the moving average method used when Heiken Ashi MA is enabled (e.g., Simple, Exponential). |
| HAMA_Period | Defines the period length for the Heiken Ashi moving average calculation. |


