What is Stratman Mini Chart Indicator?
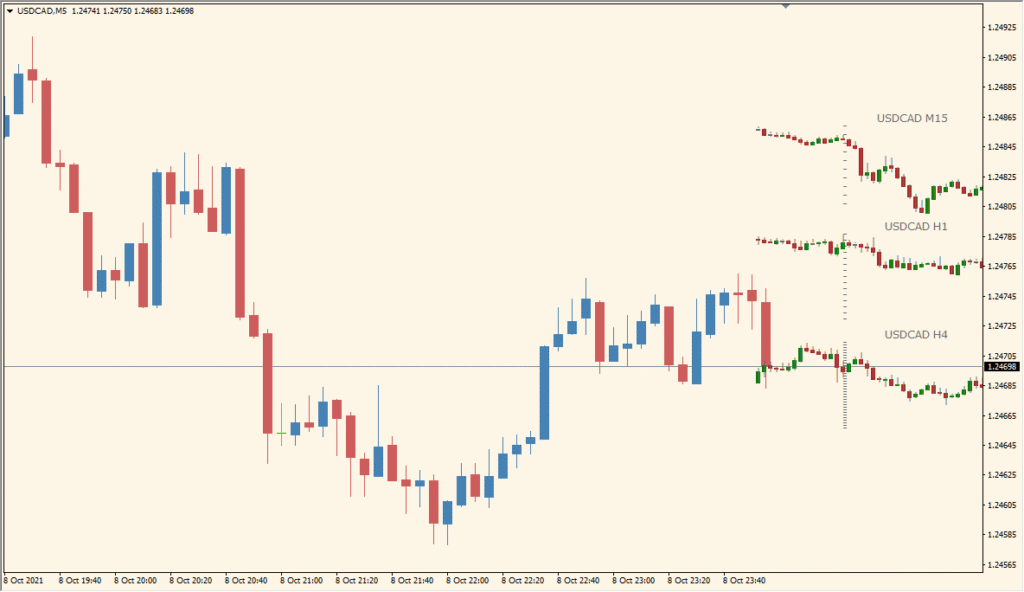
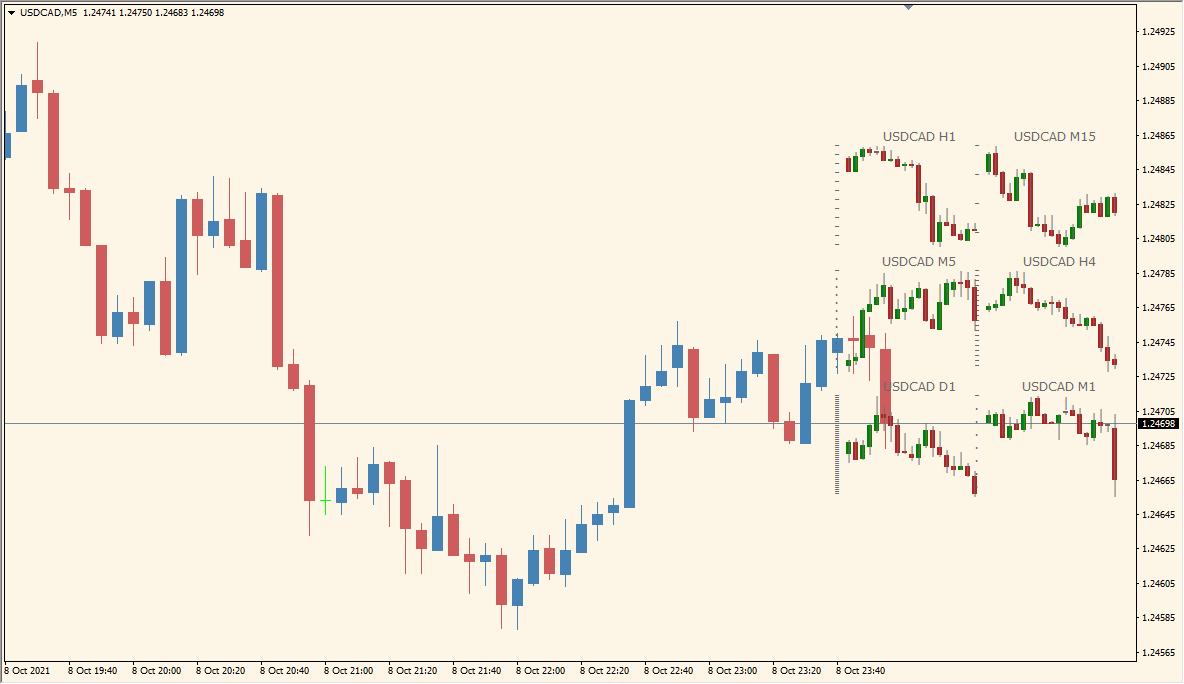
The Stratman Mini Chart indicator displays miniature candlestick charts for different timeframes directly on your main chart. This lets you observe multiple timeframes simultaneously without changing the current chart, helping you make more informed decisions based on broader market context.
Each mini chart updates in real time, with customizable position, size, colors, and timeframe settings, offering flexibility for any trading strategy.
How to Use It in Practice
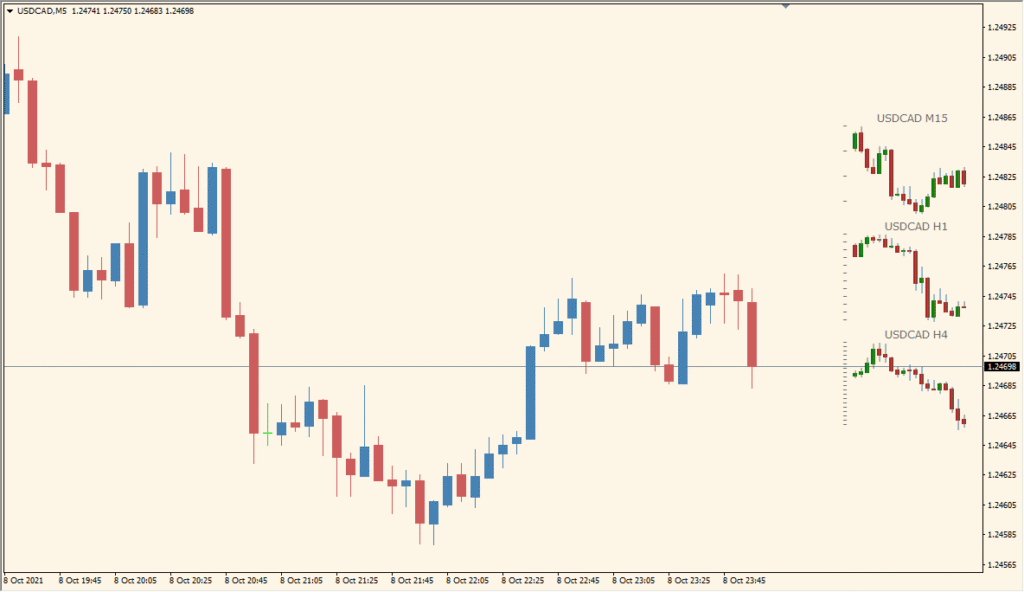
In real trading, you can use the Stratman Mini Chart to:
- Quickly compare price action across multiple timeframes (e.g., H1 and H4).
- Confirm trends or signals with higher or lower timeframes while trading on the current chart.
- Customize the placement and size to avoid clutter and fit your layout.
- Enhance situational awareness without having to open new chart windows.
This is especially useful for scalpers or intraday traders who need to stay aware of higher timeframe movements without interrupting their workflow.
Best Settings & MT4 Parameters for stratman-mini-chart
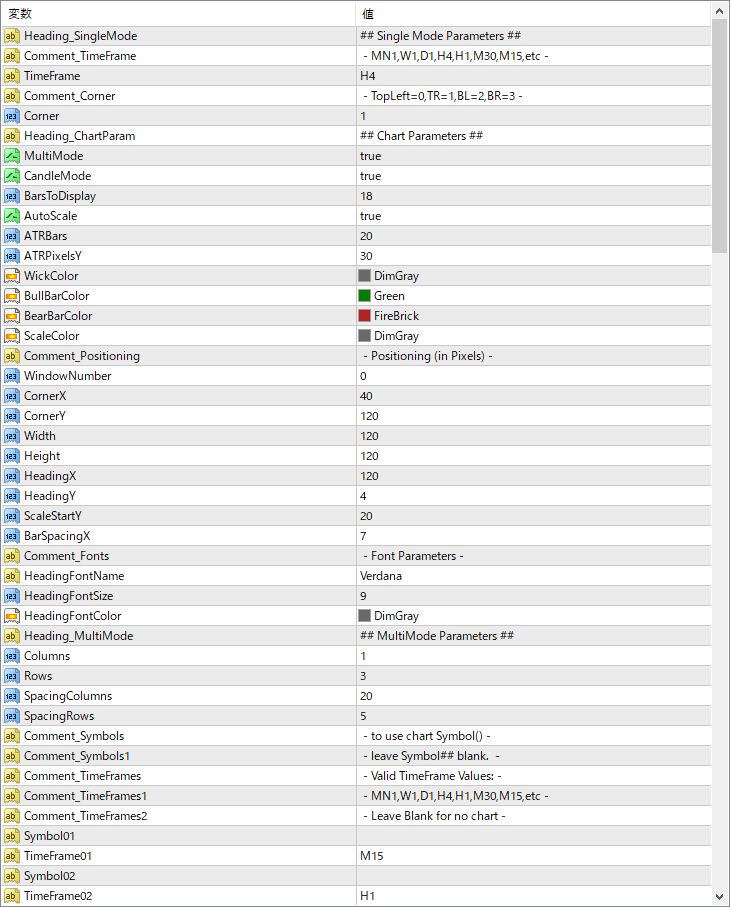
TimeFrame
Sets the timeframe to be displayed in the mini chart (e.g., H1, H4).
Corner
Chooses the screen corner for placement (0=TopLeft, 1=TopRight, etc.).
MultiMode
Enables display of multiple timeframes simultaneously.
CandleMode
Switches between candlestick and bar chart display.
BarsToDisplay
Specifies how many bars are shown in each mini chart.
AutoScale
If true, automatically adjusts chart scale based on price range.
ATRBars
Sets how many bars are used for ATR calculation (used in scaling).
ATRpixelsY
Controls vertical scaling based on ATR values.
WickColor
Color of candle wicks in the mini chart.
BullBarColor
Color for bullish (up) candles.
BearBarColor
Color for bearish (down) candles.
ScaleColor
Color used for the vertical price scale line.
WindowNumber
Chooses the subwindow (if any) where the chart will be displayed.
CornerX / CornerY
Sets the pixel offset for positioning the mini chart.
Width / Height
Specifies the size of the mini chart display in pixels.
HeadingX / HeadingY
Controls the position of the timeframe label text.
ScaleStartY
Starting Y position for the scale line inside the chart.
BarSpacingX
Defines horizontal spacing between bars in the mini chart.