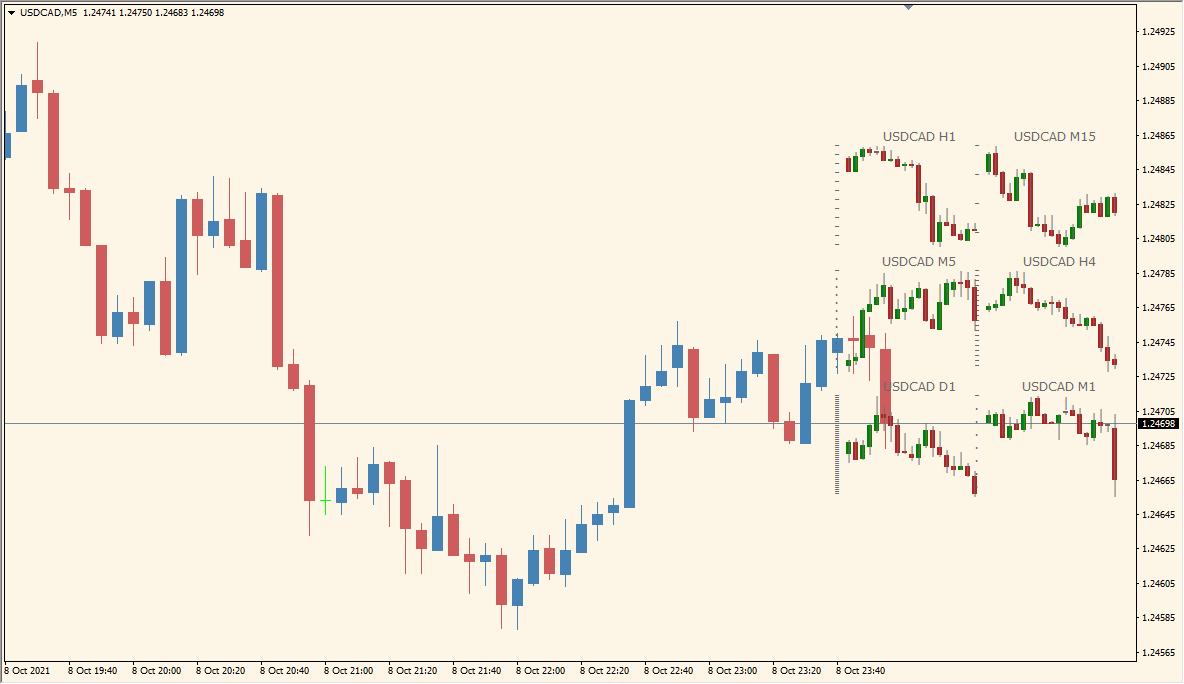
What is Stratman Mini Chart Indicator?
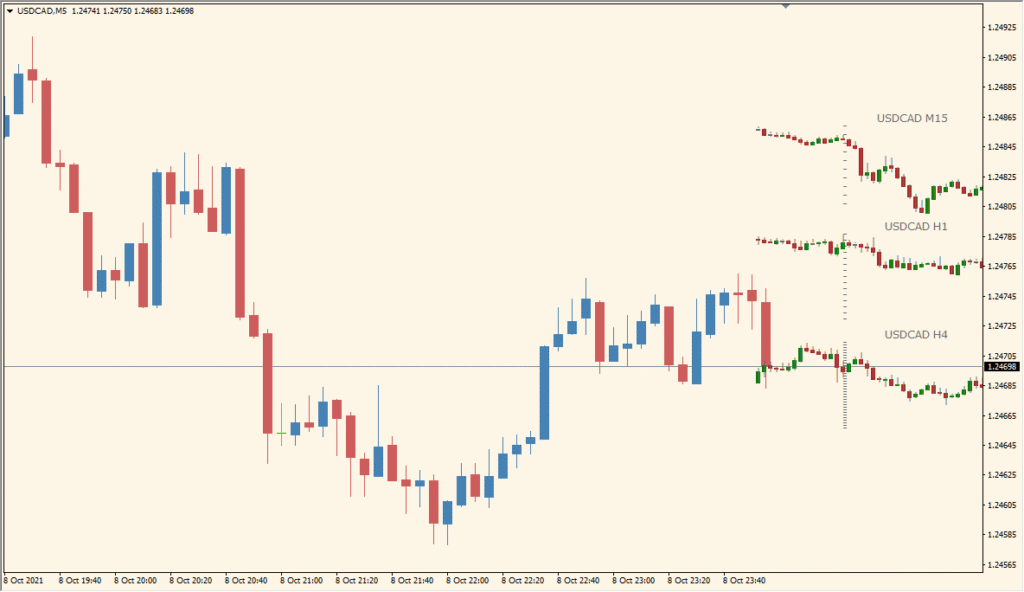
Stratman Mini Chart for MT4 places miniature candlestick or bar charts on the active chart. The mini views provide a compact way to compare price structure from other timeframes while the main chart remains visible.
TimeFrame, Corner, MultiMode, CandleMode, BarsToDisplay, AutoScale, ATRBars, size, colors, and position settings control the mini-chart layout. The display can be arranged to fit different chart sizes and review styles.
How to Use It in Practice
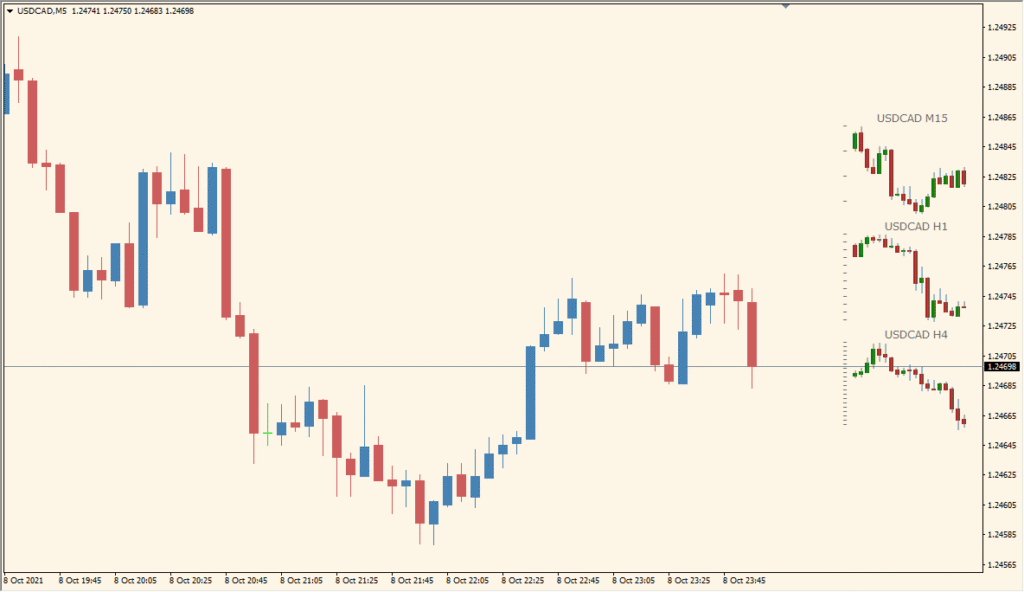
Read the miniature candle or bar charts as a grid of separately selected symbols and timeframes beside the active chart. MultiMode can switch the display from a group view to a single selected timeframe.
- Use CandleMode to switch between miniature candles and bars, then set BarsToDisplay to control the amount of history in each panel.
- With MultiMode enabled, arrange the views through Columns and Raws and assign their symbols or timeframes through the numbered settings.
- Compare the mini-chart swing shapes with the active chart while using the placement and scale controls only to keep the grid readable.
Several timeframe views fit on the active chart, candle and bar modes are available, and placement, scale, size, and color controls support flexible layouts.
MT4 Indicator Parameters
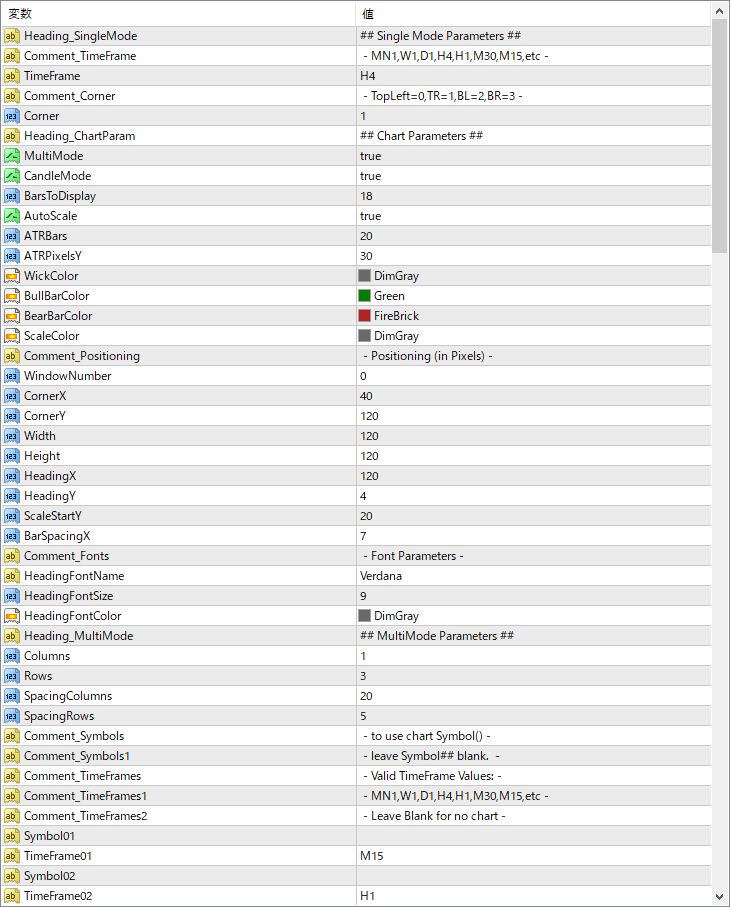
The screenshot above shows the default input parameters in the MT4 settings window.
| Parameter | Description |
|---|---|
| TimeFrame | Sets the timeframe to be displayed in the mini chart (e.g., H1, H4). |
| Corner | Chooses the screen corner for placement (0=TopLeft, 1=TopRight, etc.). |
| MultiMode | Enables display of multiple timeframes simultaneously. |
| CandleMode | Switches between candlestick and bar chart display. |
| BarsToDisplay | Specifies how many bars are shown in each mini chart. |
| AutoScale | If true, automatically adjusts chart scale based on price range. |
| ATRBars | Sets how many bars are used for ATR calculation (used in scaling). |
| ATRpixelsY | Controls vertical scaling based on ATR values. |
| WickColor | Color of candle wicks in the mini chart. |
| BullBarColor | Color for bullish (up) candles. |
| BearBarColor | Color for bearish (down) candles. |
| ScaleColor | Color used for the vertical price scale line. |
| WindowNumber | Chooses the subwindow (if any) where the chart will be displayed. |
| CornerX / CornerY | Sets the pixel offset for positioning the mini chart. |
| Width / Height | Specifies the size of the mini chart display in pixels. |
| HeadingX / HeadingY | Controls the position of the timeframe label text. |
| ScaleStartY | Starting Y position for the scale line inside the chart. |
| BarSpacingX | Defines horizontal spacing between bars in the mini chart. |


