What is Supply-Demand-Zones BT Indicator?
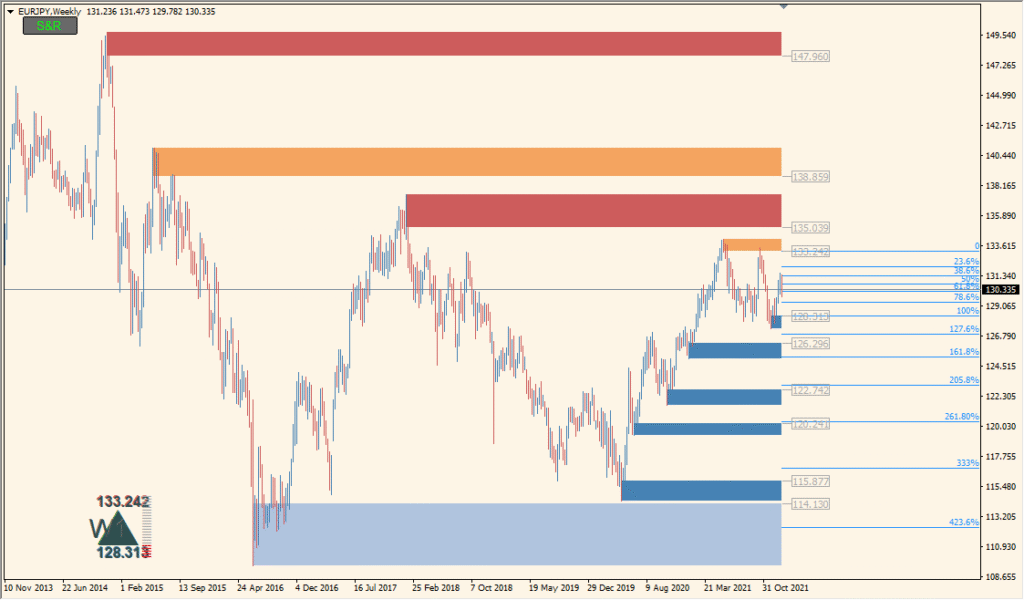
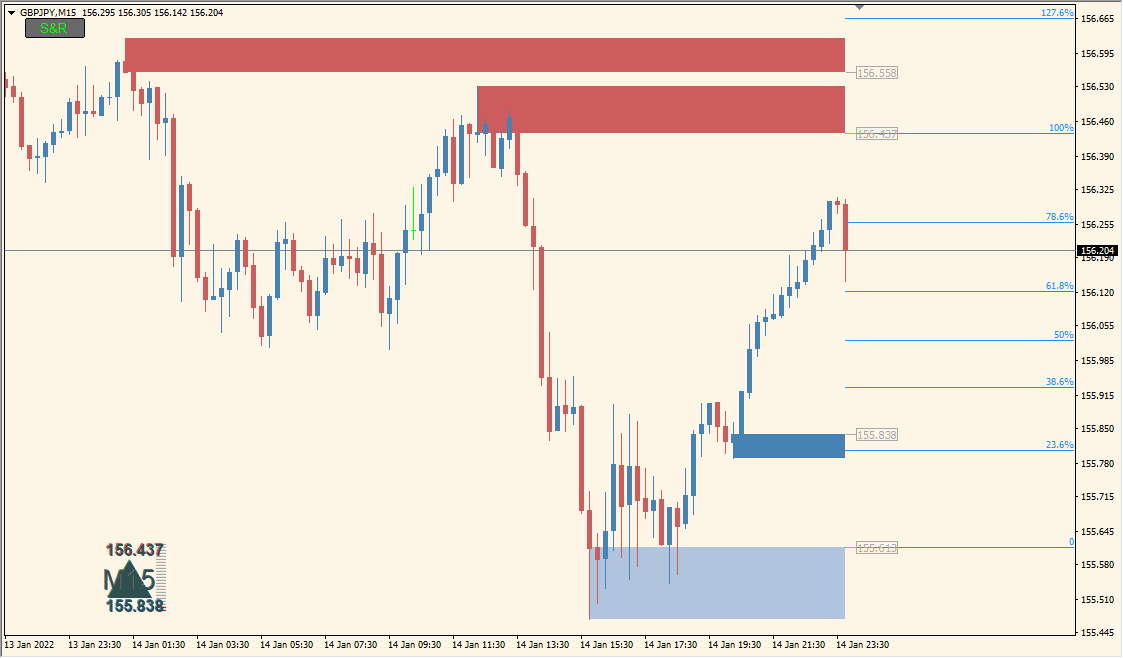
Supply-Demand-Zones BT is an MT4 indicator that displays Fibonacci levels and labeled supply and demand zones. The indicator displays labeled zones and reference levels based on recent chart structure.
These markings can make previously identified chart areas easier to review without drawing each reference manually. They are visual references, not forecasts of future price behavior.
How to Use It in Practice
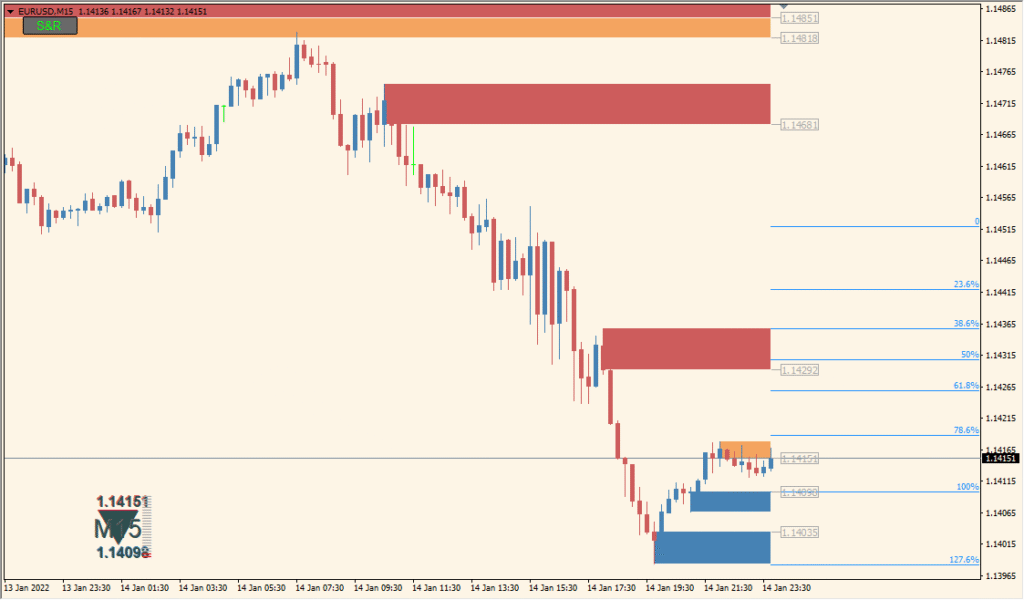
Read blue areas as the support display and red areas as the resistance display; the lighter blue and orange variants mark areas that have been tested repeatedly. Review the colored areas as zones with width, not single prices.
- Compare the darker and lighter zone colors with nearby swing history to see which areas are marked as repeatedly visited.
- Enable zone_fibs only when the optional Fibonacci markings are wanted, and use HUD_on separately for the display panel.
- Keep the colored zones distinct from the current candles so their extent can be reviewed without turning them into fixed expectations.
Automatically displayed zones reduce repetitive manual marking, color-coded areas can make the chart layout easier to scan, and reference levels are available together with the marked zones.
MT4 Indicator Parameters
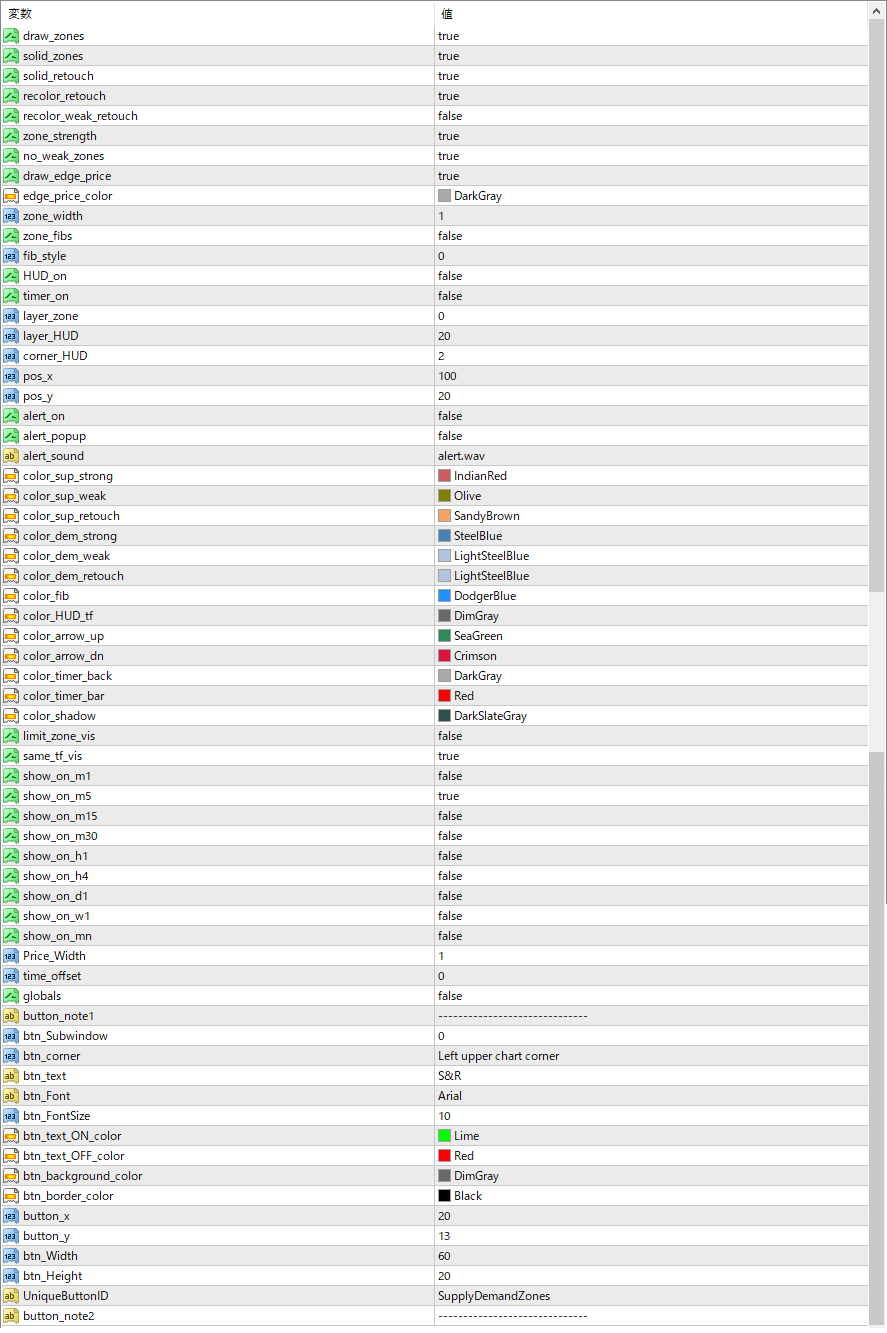
The screenshot above shows the default input parameters in the MT4 settings window.
| Parameter | Description |
|---|---|
| ZoneStrength | Sets how many bars the indicator will look back to confirm a valid supply or demand zone. |
| ZoneLookback | Defines how far back in history to search for new zones. This limits how many old zones appear on the chart. |
| ExtendZones | If enabled, the rectangles for the zones will extend forward on the chart until price breaks through them. Useful for tracking long-standing levels. |
| ZoneFillColorSupply | Specifies the fill color used for supply zones (typically red or orange). |
| ZoneFillColorDemand | Specifies the fill color used for demand zones (typically blue or green). |
| ZoneBorderColor | Sets the border color for all zone rectangles. |
| ZoneOpacity | Controls how transparent or solid the zone fill color appears. Lower values make the zones more transparent. |
| DeleteOldZones | If enabled, the indicator removes older zones that have already been invalidated by price. |
| ShowZoneLabels | Displays labels such as “Supply” or “Demand” inside each zone. |


