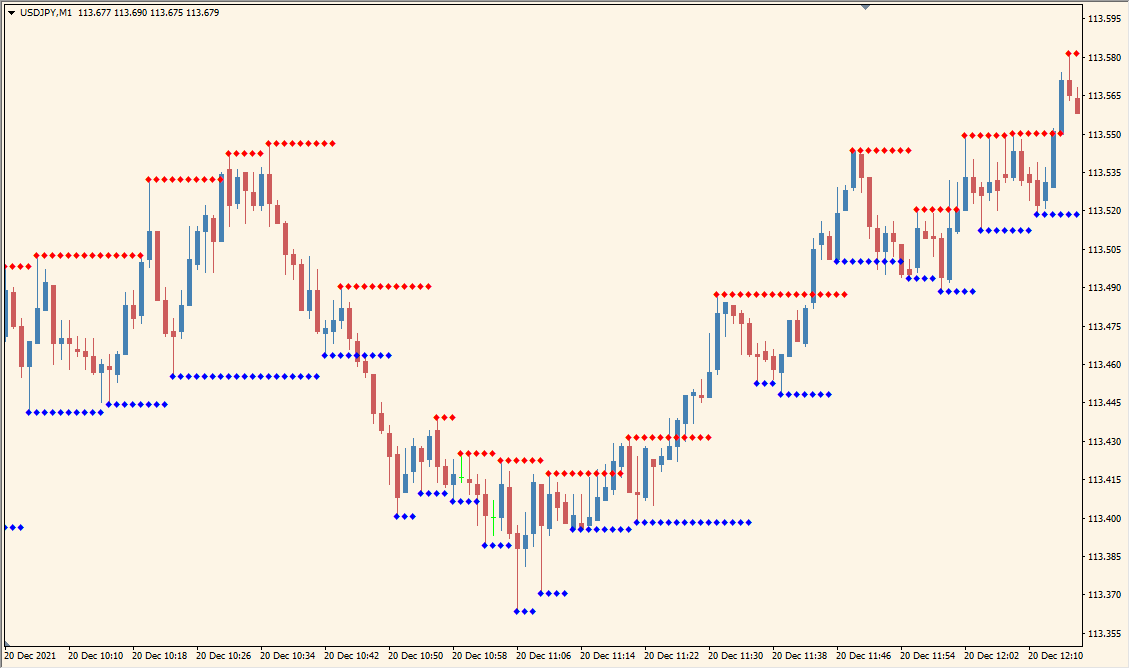
What is Support and Resistance (Barry) Indicator?
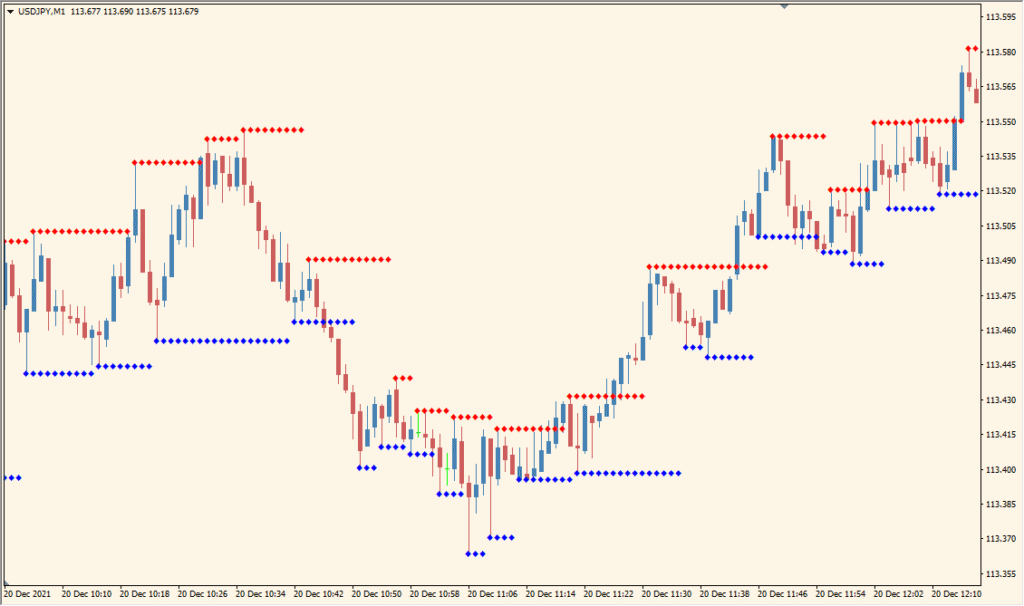
Support and Resistance Barry for MT4 plots visual markers from recent swing highs and lows. Red dots mark the resistance-side references above price, while blue dots mark the support-side references below price.
The indicator keeps the overlay compact and focused on recent price structure. The Red and Blue color settings control the appearance of the two marker groups.
How to Use It in Practice
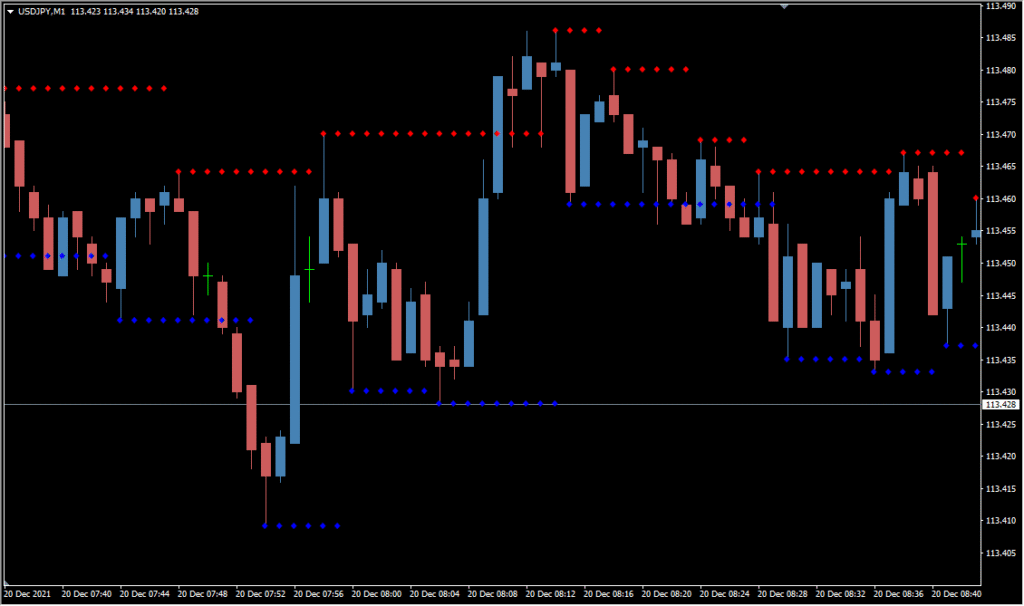
Read the red and blue marks as the recent high and low references shown by this simple Barry display. Compare their placement with the surrounding swings; the markings are a compact visual aid, not a complete level-analysis method.
- Review each red or blue point against the nearby candles that formed the corresponding recent extreme.
- Use the Red and Blue color settings only to keep the two marker groups readable on the chosen chart theme.
- Compare the small marker set with broader swing structure rather than assuming the display alone explains a level.
Recent highs and lows are shown with a simple two-color display, the chart remains uncluttered, and marker colors can be customized.
MT4 Indicator Parameters
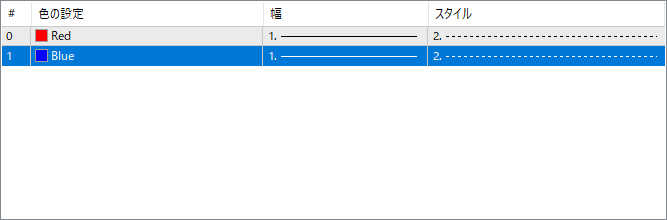
The screenshot above shows the default input parameters in the MT4 settings window.
| Parameter | Description |
|---|---|
| Red | Defines the color of the resistance dots plotted above the price. These dots mark recent swing highs where price might reverse or pause. |
| Blue | Defines the color of the support dots plotted below the price. These dots highlight recent swing lows and are potential bounce areas. |


