What is Support and Resistance (Barry) Indicator?
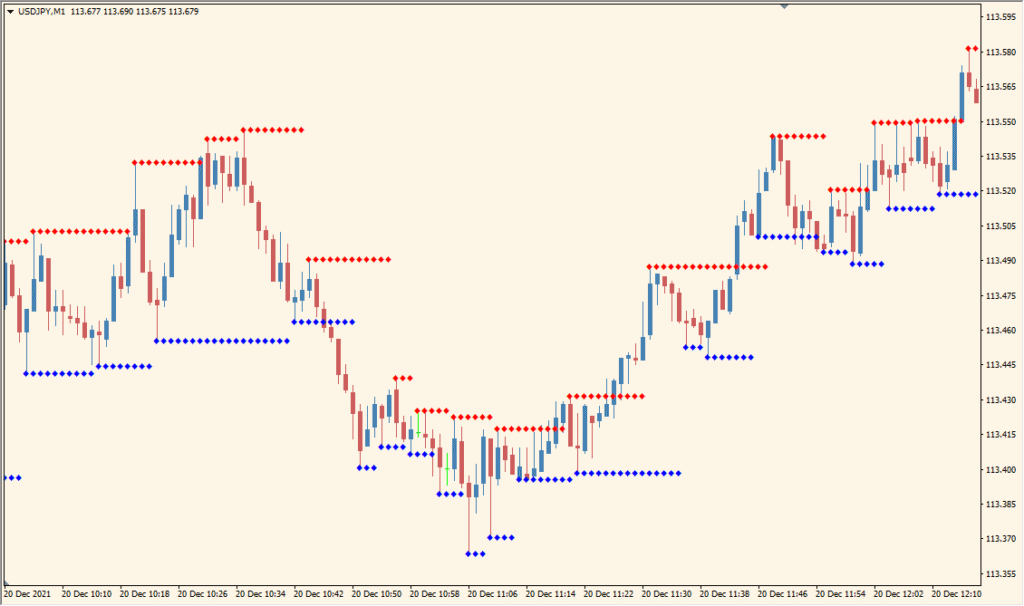
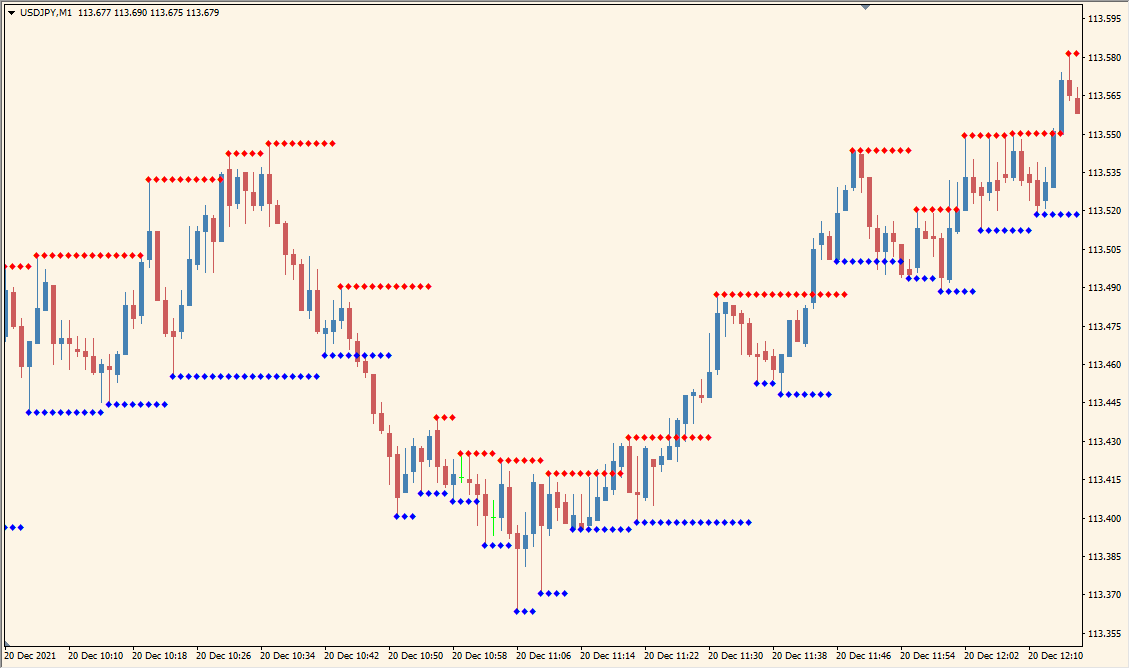
The Support and Resistance (Barry) indicator for MT4 visually plots key support and resistance levels based on recent swing highs and lows. Red dots represent resistance zones, while blue dots mark support areas. These levels adjust dynamically as new highs or lows form, giving traders a quick way to identify potential reversal or breakout points.
This tool is helpful for traders who rely on simple price action structures rather than complex calculations. It offers a clean and uncluttered visual reference directly on the chart.
How to Use It in Practice
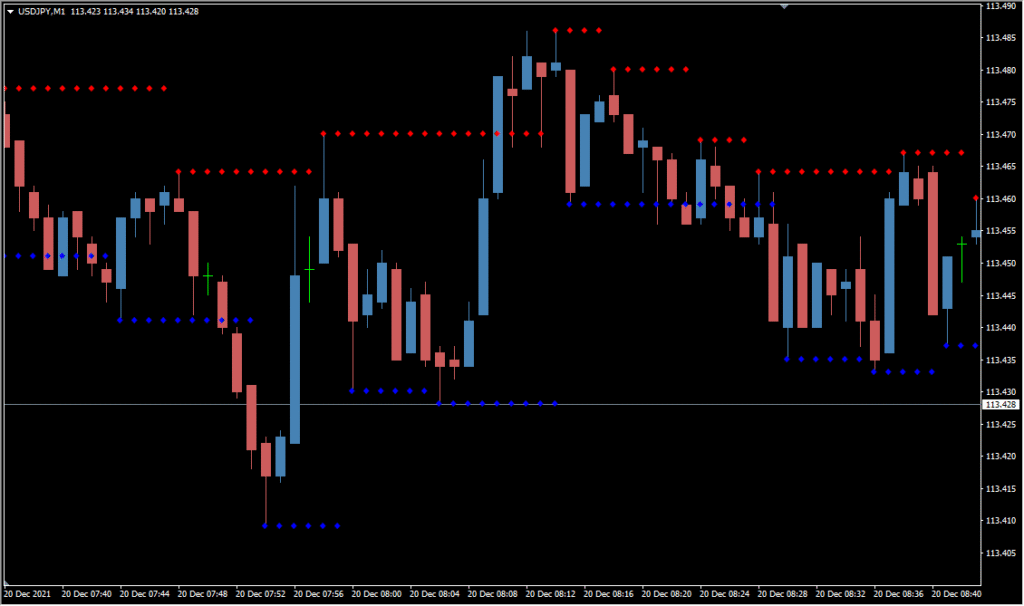
In live trading, this indicator can be used to:
- Identify key support and resistance zones at a glance.
- Plan entries and exits around major turning points.
- Use the dots as confirmation areas for trend reversals or breakouts.
- Filter false breakouts by checking if price holds above support or below resistance after a move.
It’s particularly useful for discretionary traders who prefer clean charts and quick visual cues over indicator-heavy setups.
Best Settings & MT4 Parameters for Support and Resistance (Barry)
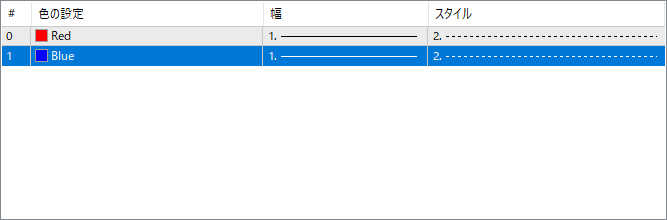
Red
Defines the color of the resistance dots plotted above the price. These dots mark recent swing highs where price might reverse or pause.
Blue
Defines the color of the support dots plotted below the price. These dots highlight recent swing lows and are potential bounce areas.