What is Support & Resistance Barry?
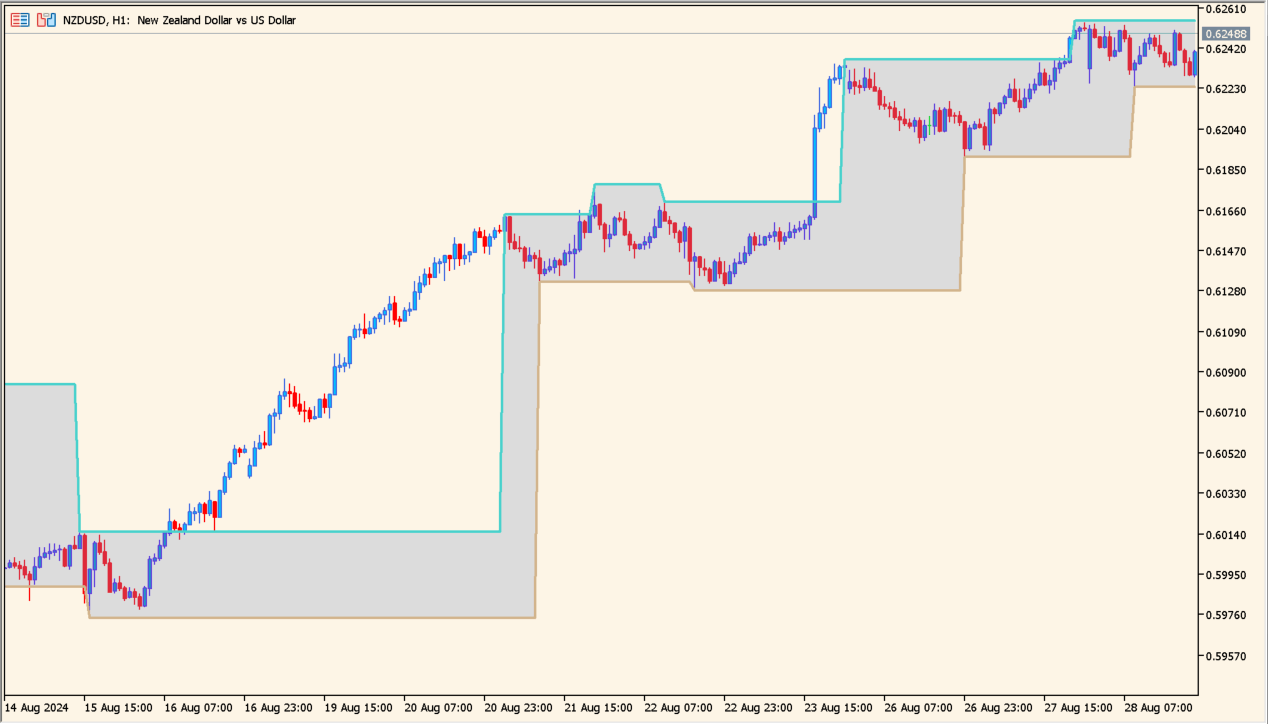
Support & Resistance Barry is an MT5 indicator that automatically identifies and displays fractal support and resistance levels on the chart.
It draws horizontal dot lines at key swing highs and lows, helping traders spot potential reaction zones and price breakouts.
How to use Support & Resistance Barry
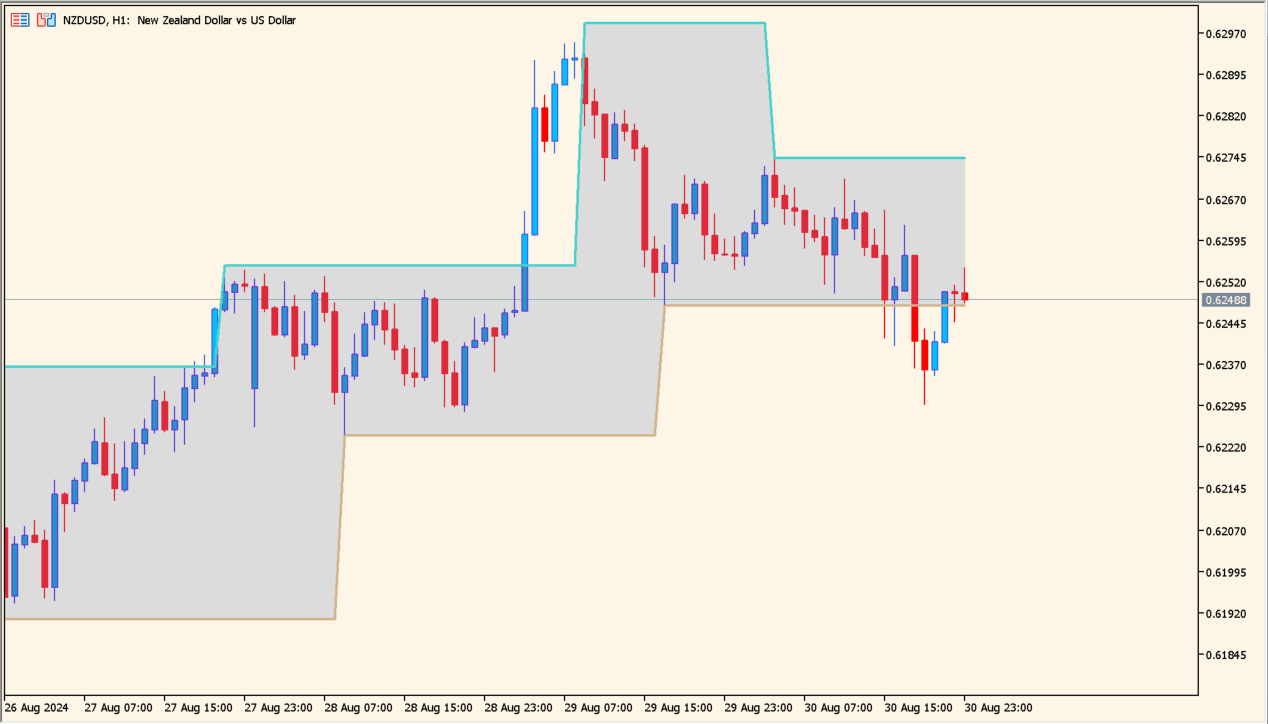
Attach Support & Resistance Barry to your chart to observe visual fractal dot levels and horizontal support/resistance lines.
Watch for price reaction near historical dot lines to identify potential trend continuation or reversal setups.
Where it helps
Displays high and low fractal level dots directly on MT5 price charts.
Draws horizontal dot lines marking recent fractal high and low levels.
MT5 Indicator Parameters
The table below lists the available MT5 indicator parameters. You can customize these options in the MetaTrader Inputs dialog to match your trading preferences.
| Parameter | Description |
|---|---|
| ShowHighDots | Enables or disables upper fractal dot display. Default: true. |
| ShowLowDots | Enables or disables lower fractal dot display. Default: true. |
| HighDotColor | Sets color for upper fractal level dots. Default: clrRed. |
| LowDotColor | Sets color for lower fractal level dots. Default: clrBlue. |
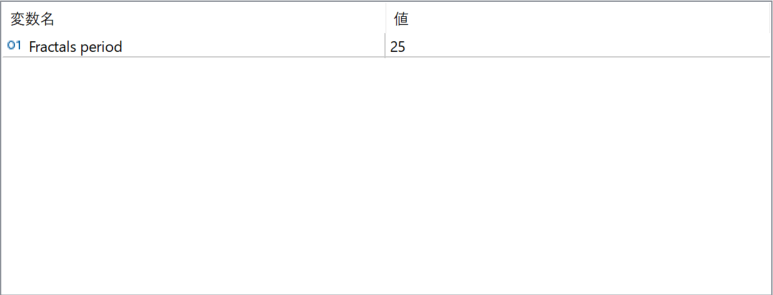
The screenshot above shows the default input parameters in the MT5 settings window.
How to Install .ex5 Indicator in MetaTrader 5
- Download the ZIP file and extract it.
- In MT5, select File → Open Data Folder.
- Open MQL5 → Indicators and copy the EX5 or MQ5 file into it.
- If the package includes library files, copy them to MQL5 → Libraries. Copy TPL files to the top-level templates folder.
- Restart MT5, find the indicator in the Navigator, and drag it onto a chart.
Test the tool on a demo account first. File contents and required folders can vary between packages.


