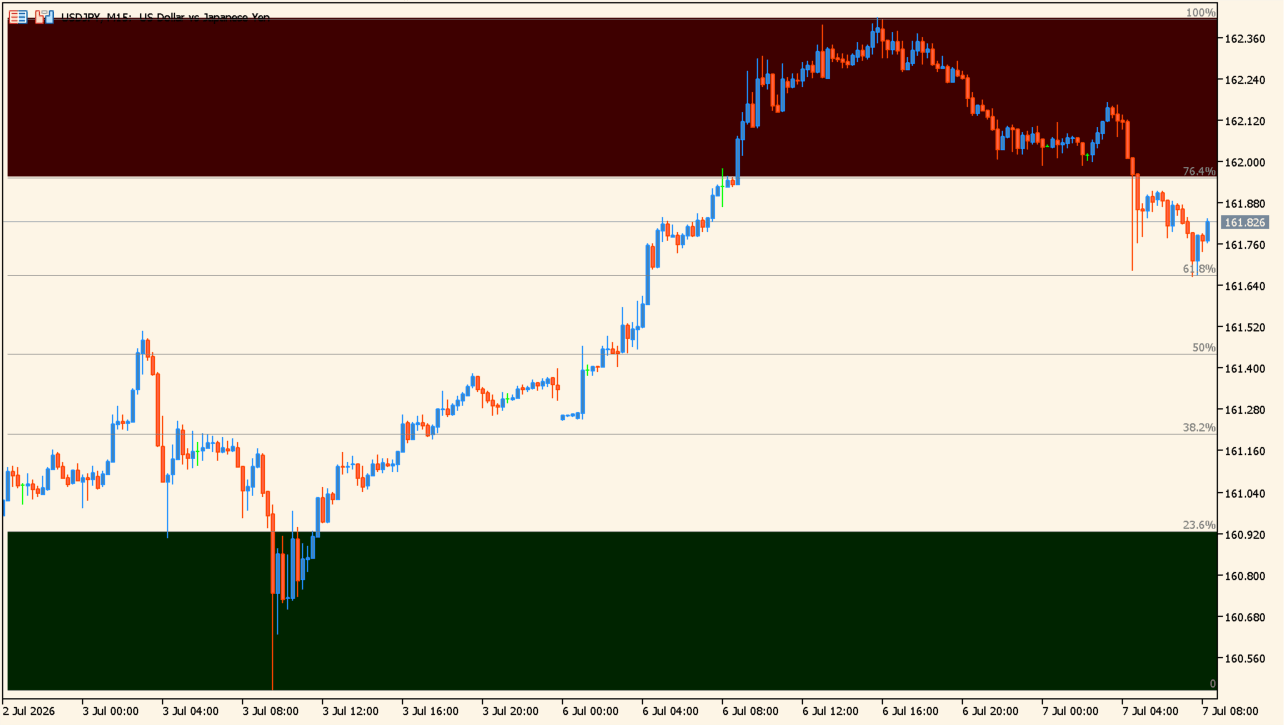
What is Support Demand?
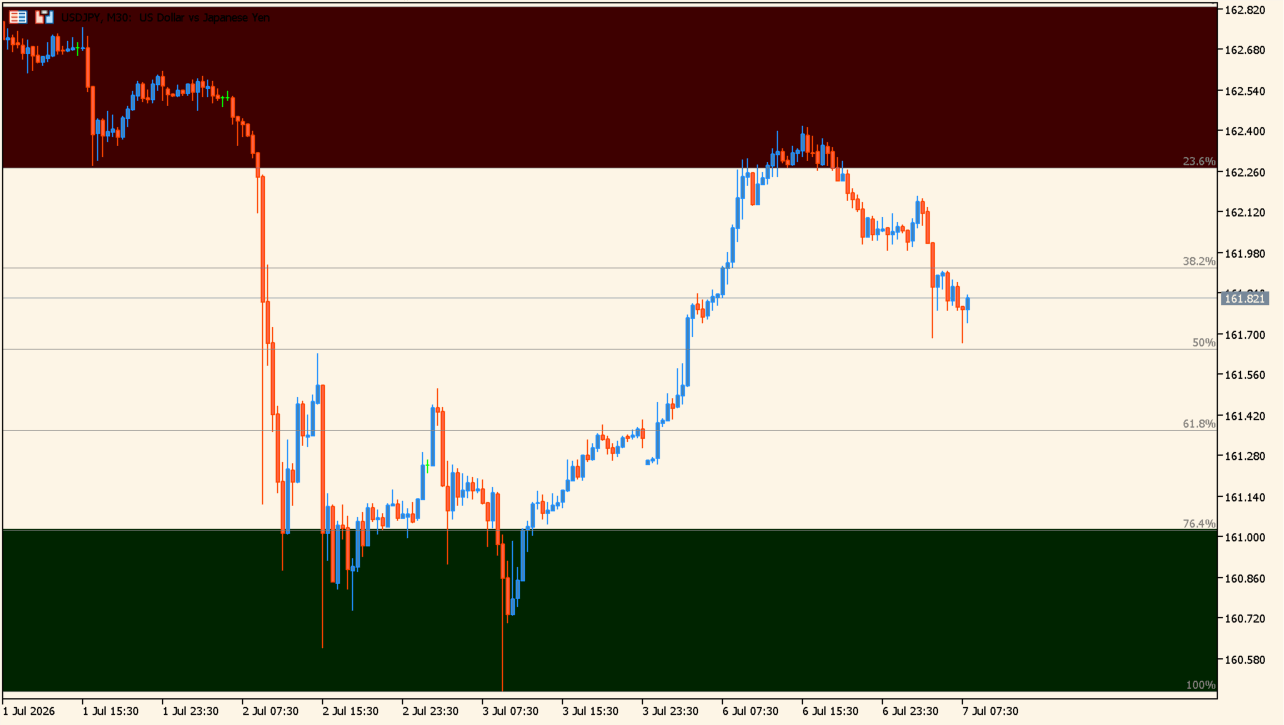
Support Demand calculates a selected price range and places Fibonacci levels from 23.6% to 100% on an MT5 chart. The display also shades an upper red zone and a lower green zone around that range.
The layout makes the current price position within the configured range easier to inspect. It does not determine how price will behave at a displayed line or zone.
How to use Support Demand
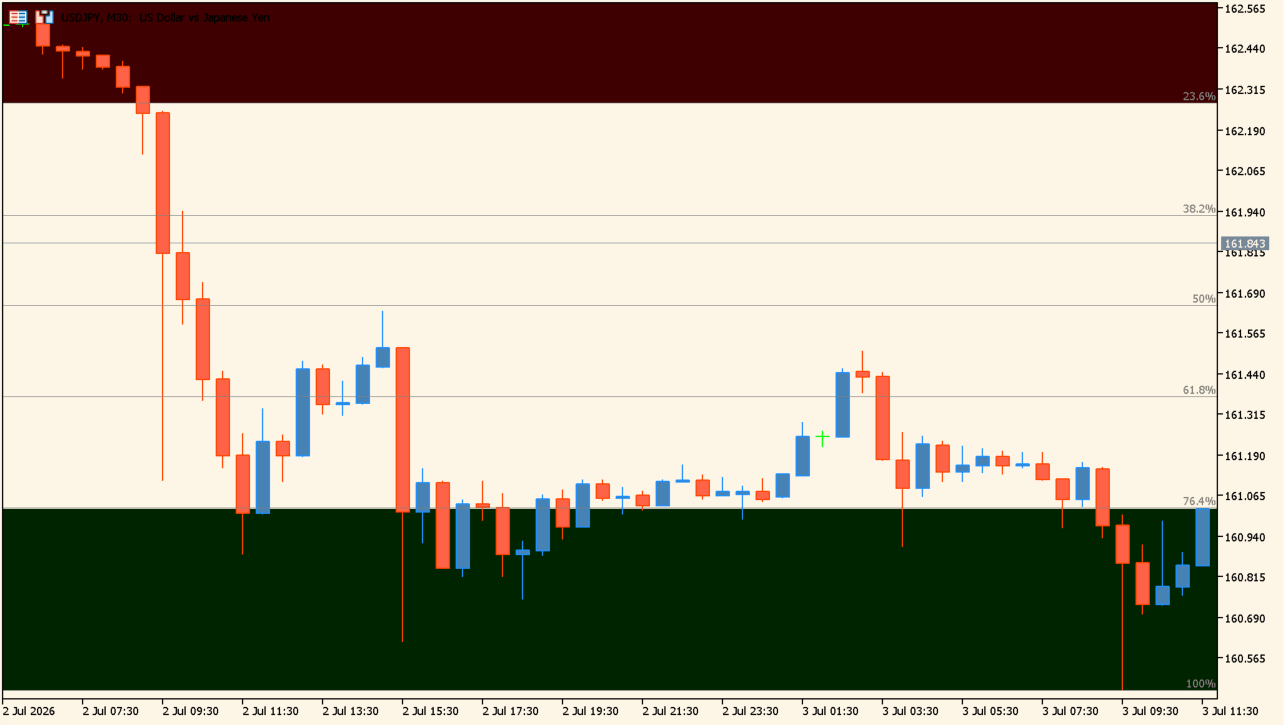
Compare the 38.2%, 50%, and 61.8% levels with recent highs, lows, and candle behavior. The shaded areas can be reviewed as parts of the range rather than as standalone instructions.
Fibo Period sets the reference range. The line, channel, style, and color options control which elements remain visible on the chart.
Where it helps
Fibonacci lines and upper/lower zones are shown in one chart layout.
Fibo Period changes the range used to place the displayed levels.
Line, channel, style, and color settings can be changed independently.
MT5 Indicator Parameters
The table below lists the available MT5 indicator parameters. You can customize these options in the MetaTrader Inputs dialog to match your trading preferences.
| Parameter | Description |
|---|---|
| Fibo Period | Sets the period used to calculate the Fibonacci range. Default: 240. |
| Show Start Line | Shows or hides the range start line. Default: false. |
| Show End Line | Shows or hides the range end line. Default: false. |
| Show Channel | Shows or hides the channel display. Default: false. |
| Fibo Style | Selects the Fibonacci-line display style. Default: Don't draw. |
| Fibo Color | Sets the Fibonacci-line color. Default: Gray. |
| Start Line Color | Sets the start-line color. Default: RoyalBlue. |
| End Line Color | Sets the end-line color. Default: Maroon. |
| Buy Zone Color | Sets the lower zone color. Default: 0,36,0. |
| Sell Zone Color | Sets the upper zone color. Default: 62,0,0. |
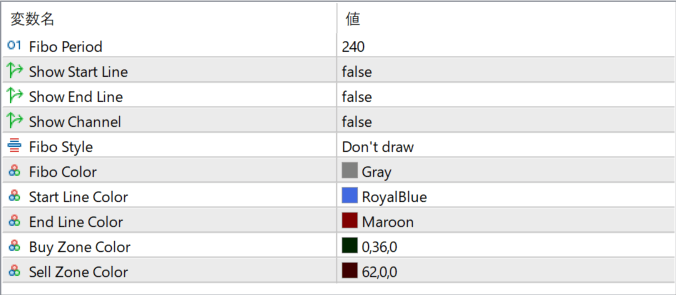
The screenshot above shows the default input parameters in the MT5 settings window.
How to Install .ex5 Indicator in MetaTrader 5
- Download the ZIP file and extract it.
- In MT5, select File → Open Data Folder.
- Open MQL5 → Indicators and copy the EX5 or MQ5 file into it.
- If the package includes library files, copy them to MQL5 → Libraries. Copy TPL files to the top-level templates folder.
- Restart MT5, find the indicator in the Navigator, and drag it onto a chart.
Test the tool on a demo account first. File contents and required folders can vary between packages.


