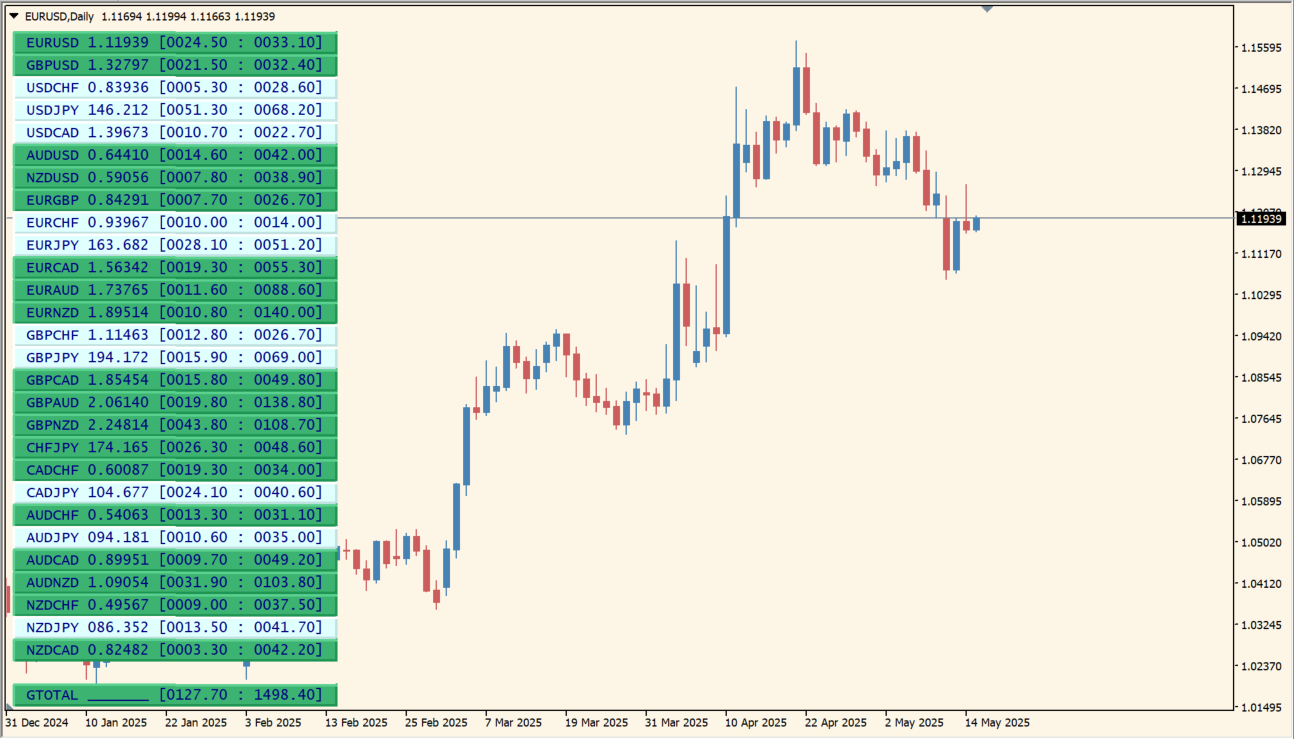
What is Symbol Movement Indicator?
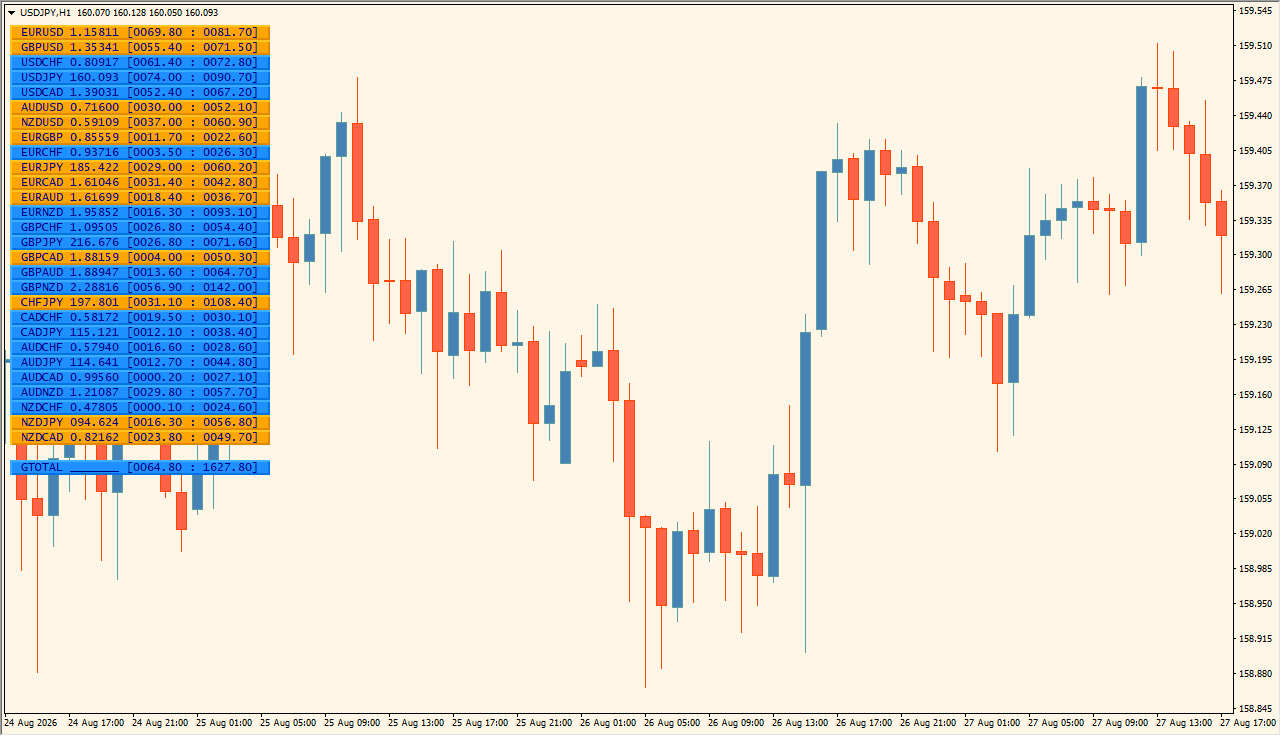
Symbol Movement is an MT4 panel that displays rates and movement across multiple currency pairs. It uses a selected candle count and timeframe to present the panel values, with color settings for the displayed buttons.
The panel is intended to make cross-pair comparison easier from a single chart. It provides a compact visual reference rather than a forecast or recommendation.
How to Use It in Practice
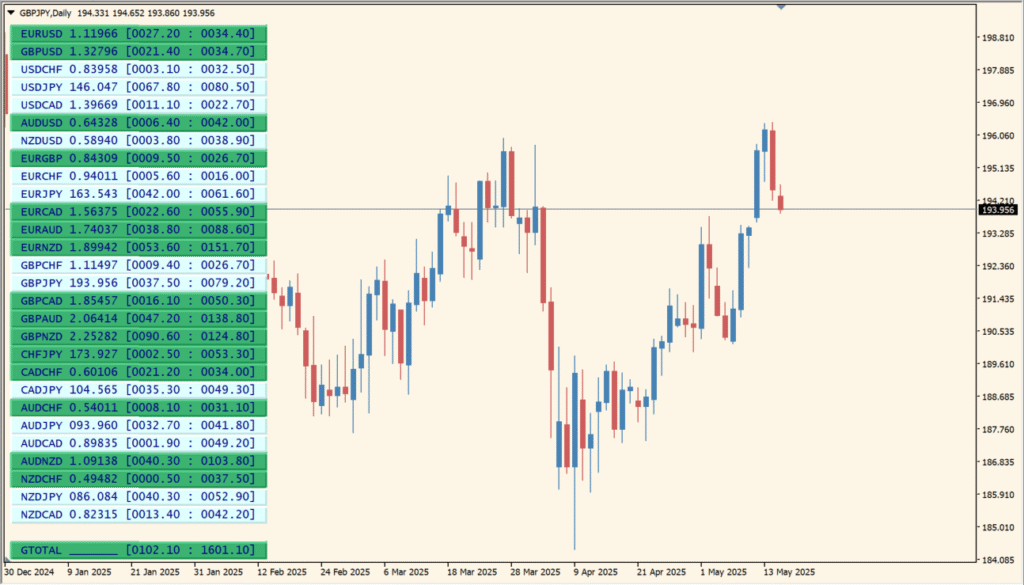
Use the panel to review movement across the selected symbols:
- Choose the existing candle-count and timeframe settings for the movement display.
- Review the panel to compare the displayed movement across the selected pairs.
- Use the button colors as labels for the panel’s up and down movement display.
- When configured to do so, select a symbol button to switch the current chart to that pair’s chart context.
Multiple pairs can be reviewed from one panel, button colors make the displayed movement categories easier to scan, and the optional chart-switching behavior can reduce repeated symbol selection.
MT4 Indicator Parameters
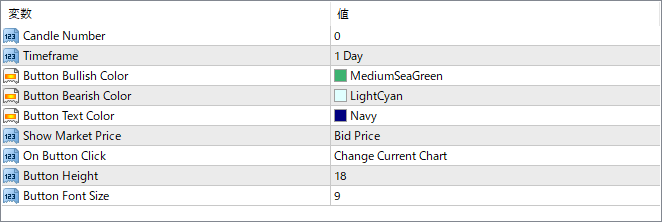
The screenshot above shows the default input parameters in the MT4 settings window.
| Parameter | Description |
|---|---|
| Candle Number | Sets how many candles (bars) are used to calculate the price movement. A higher number provides a longer-term view of movement, while a lower number focuses on short-term changes. |
| Timeframe | Specifies the timeframe on which the movement analysis is based (e.g., 1 Day, 1 Hour, etc.). This determines the scale of the movement measurement. |
| Button Bullish Color | Defines the background color of the button when a currency pair has moved up (bullish) over the selected period. |
| Button Bearish Color | Defines the background color of the button when a currency pair has moved down (bearish) over the selected period. |
| Button Text Color | Sets the color of the text shown inside each button. |
| Show Market Price | Specifies what price is displayed in the buttons — options typically include Bid Price or Ask Price. |
| On Button Click | Determines the action when a button is clicked. This can be set to change the current chart to the selected symbol or take no action. |
| Button Width | Controls the width of each button in pixels. Wider buttons allow for more readable data display. |
| Button Height | Controls the height of each button in pixels. |
| Button Font Size | Sets the font size of the text shown inside each button for better readability. |


