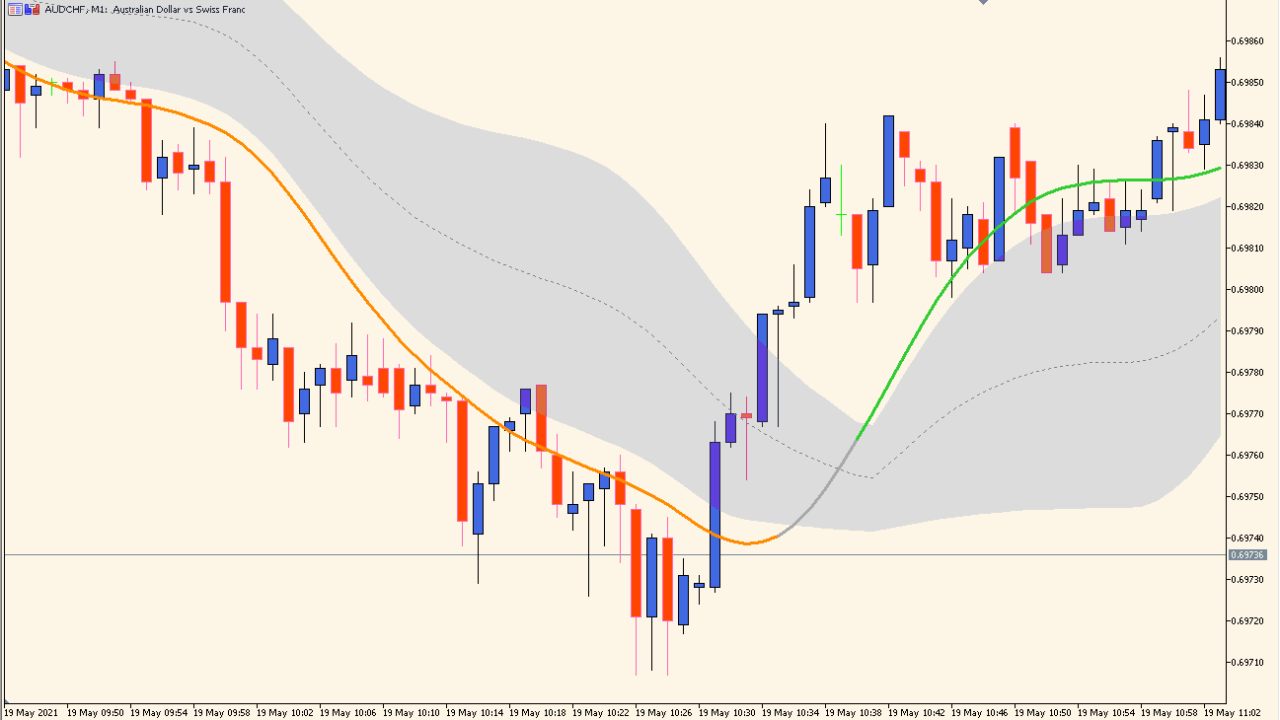
What is T3 Floating Levels Indicator?
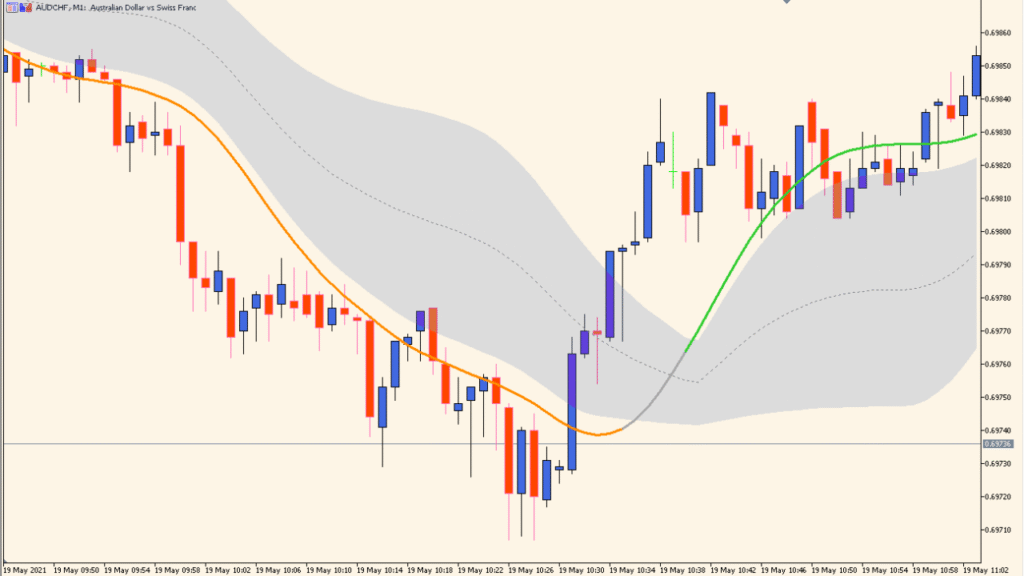
T3 Floating Levels is an MT5 chart indicator that displays upper and lower reference levels around a T3 moving average. T3 period, percentage distances, price source, colors, and line settings control the overlay.
How to Use It in Practice
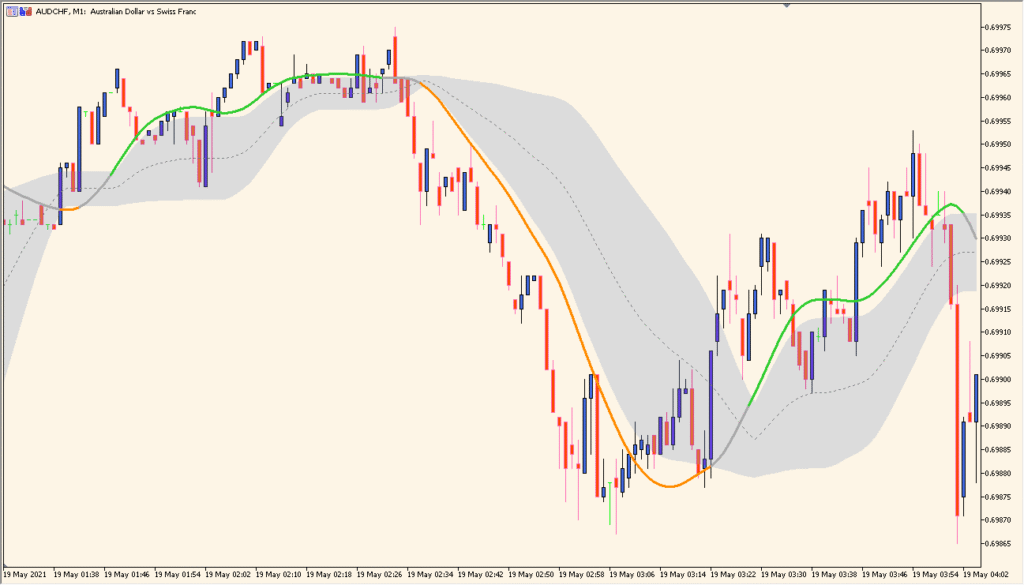
T3 Floating Levels combines a T3MA center line with a surrounding floating band and a gray cloud. The cloud width is the part that changes with the floating-level settings.
- Read the T3MA center line, the surrounding floating band, and the gray cloud as separate parts of the same overlay.
- Keep the indicator on the active timeframe or select a different timeframe from its multi-timeframe setting when that comparison is required.
- Adjust Period for finding floating levels together with Upper level% and Lower level% to change the cloud width; otherwise leave these at their defaults.
- Treat T3 hot as the T3MA smoothing factor; changing it has little visible effect.
A smoothed center and surrounding references appear together, while percentage and styling controls support different chart views.
MT5 Indicator Parameters
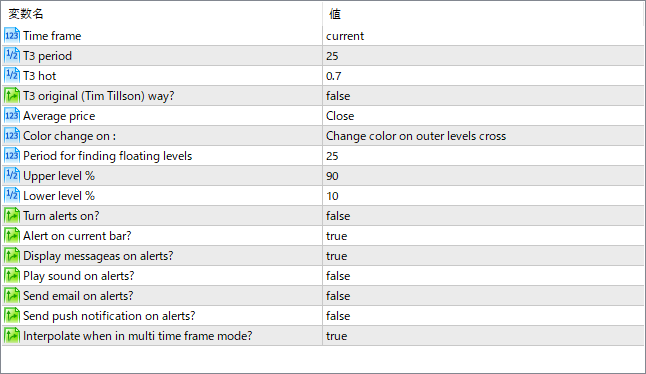
The screenshot above shows the default input parameters in the MT5 settings window.
| Parameter | Description |
|---|---|
| Time frame | Selects the chart timeframe for the calculation. Can be set to the current chart or a higher/lower timeframe for multi-timeframe analysis. |
| T3 period | Defines the number of periods used to calculate the T3 moving average. |
| T3 hot | Controls the smoothing factor of the T3 moving average. Higher values make the curve smoother but slower to react. |
| T3 original (Tim Tillson) way? | If enabled, uses the original Tim Tillson calculation method for the T3 average. |
| Average price | Specifies which price type (Close, Open, High, Low, etc.) is used for the T3 calculation. |
| Color change on | Defines the condition for changing the indicator’s color (e.g., when price crosses outer levels). |
| Period for finding floating levels | Number of bars used to determine the floating levels above and below the T3 line. |
| Upper level % | Percentage above the T3 line to set the upper floating level. |
| Lower level % | Percentage below the T3 line to set the lower floating level. |
| Turn alerts on? | Enables or disables alerts when conditions are met. |
| Alert on current bar? | When enabled, triggers alerts immediately on the current forming candle instead of waiting for bar close. |
| Display messages on alerts? | Shows a pop-up message when an alert is triggered. |
| Play sound on alerts? | Plays an audio notification when an alert condition is met. |
| Send email on alerts? | Sends an email when the alert condition is triggered (requires email setup in the platform). |
| Send push notification on alerts? | Sends a push notification to the connected mobile app when alerts occur. |
| Interpolate when in multi time frame mode? | When using higher timeframe data on a lower timeframe chart, interpolates values between bars for smoother display. |


