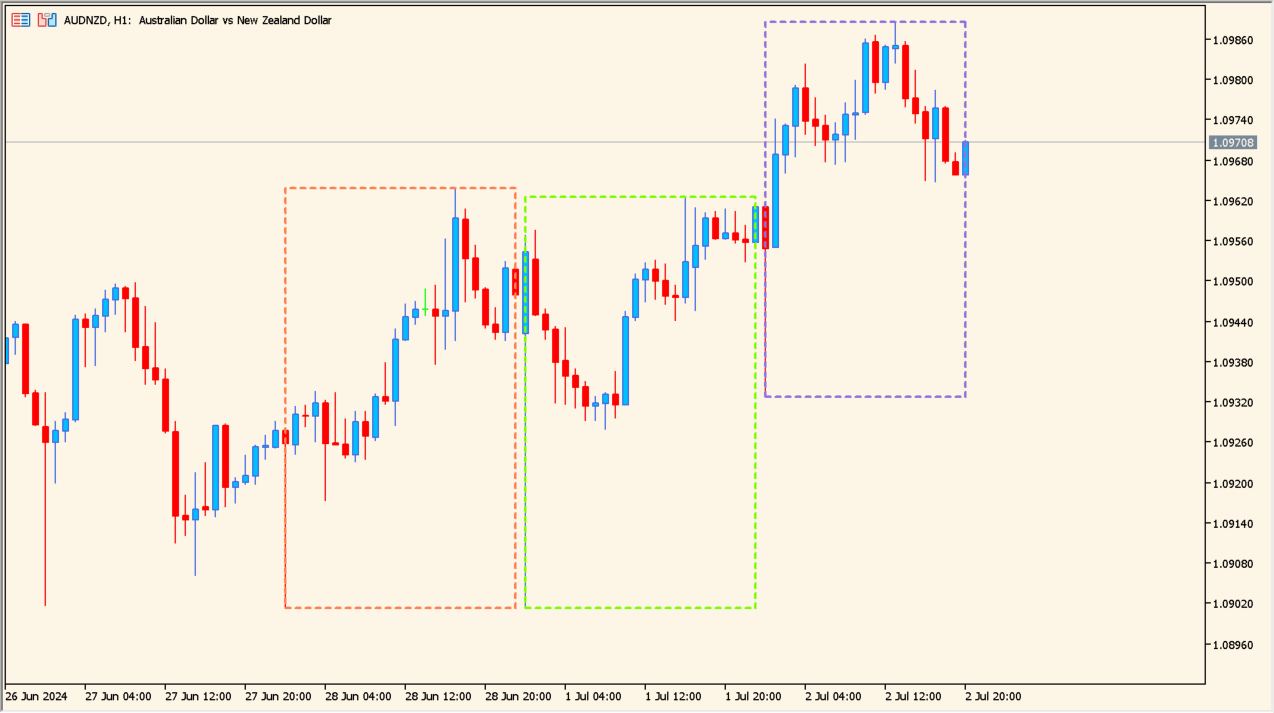
What is Three Daily Rectangles 1.000?
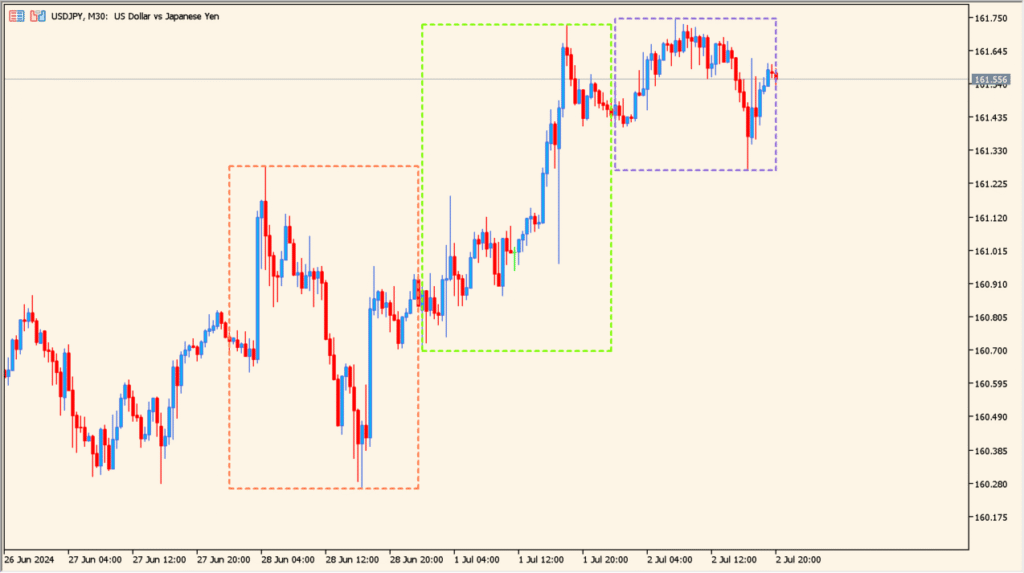
Three Daily Rectangles 1.000 is an MT5 indicator that automatically draws shaded box boundaries covering the high-to-low range of the last three trading days.
It provides clear visual reference zones for multi-day range contraction, expansion, and key level retests.
How to use Three Daily Rectangles 1.000
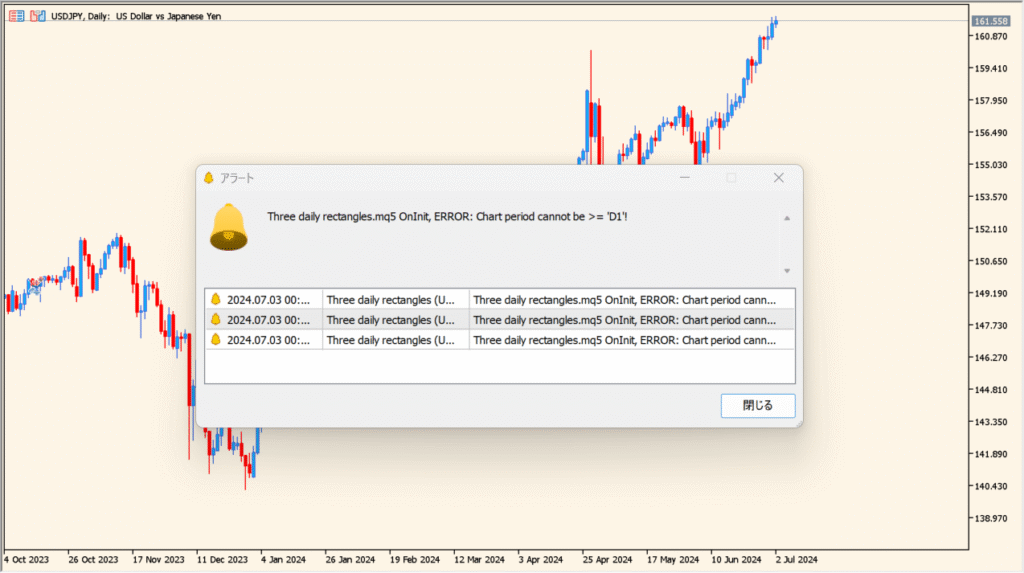
Use previous daily highs and lows as key reference levels for intraday support and resistance.
Compare relative daily range sizes to identify contracting or expanding volatility periods.
Where it helps
Draws distinct rectangular boxes for the previous 3 trading days.
Helps identify key daily high and low reference zones instantly.
MT5 Indicator Parameters
The table below lists the available MT5 indicator parameters. You can customize these options in the MetaTrader Inputs dialog to match your trading preferences.
| Parameter | Description |
|---|---|
| Day 1 Rectangle Color | Sets the fill color for yesterday's daily price range rectangle. Default: LightBlue. |
| Day 2 Rectangle Color | Sets the fill color for the daily price range rectangle from two days ago. Default: LightGreen. |
| Day 3 Rectangle Color | Sets the fill color for the daily price range rectangle from three days ago. Default: LightYellow. |
| Show Range Pips | Displays the pip size of each daily range on the chart. Default: true. |
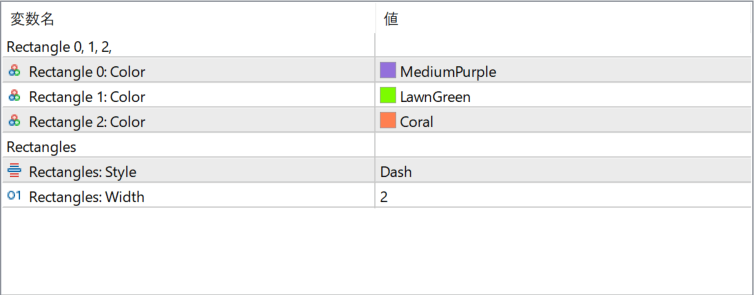
The screenshot above shows the default input parameters in the MT5 settings window.
How to Install .ex5 Indicator in MetaTrader 5
- Download the ZIP file and extract it.
- In MT5, select File → Open Data Folder.
- Open MQL5 → Indicators and copy the EX5 or MQ5 file into it.
- If the package includes library files, copy them to MQL5 → Libraries. Copy TPL files to the top-level templates folder.
- Restart MT5, find the indicator in the Navigator, and drag it onto a chart.
Test the tool on a demo account first. File contents and required folders can vary between packages.


