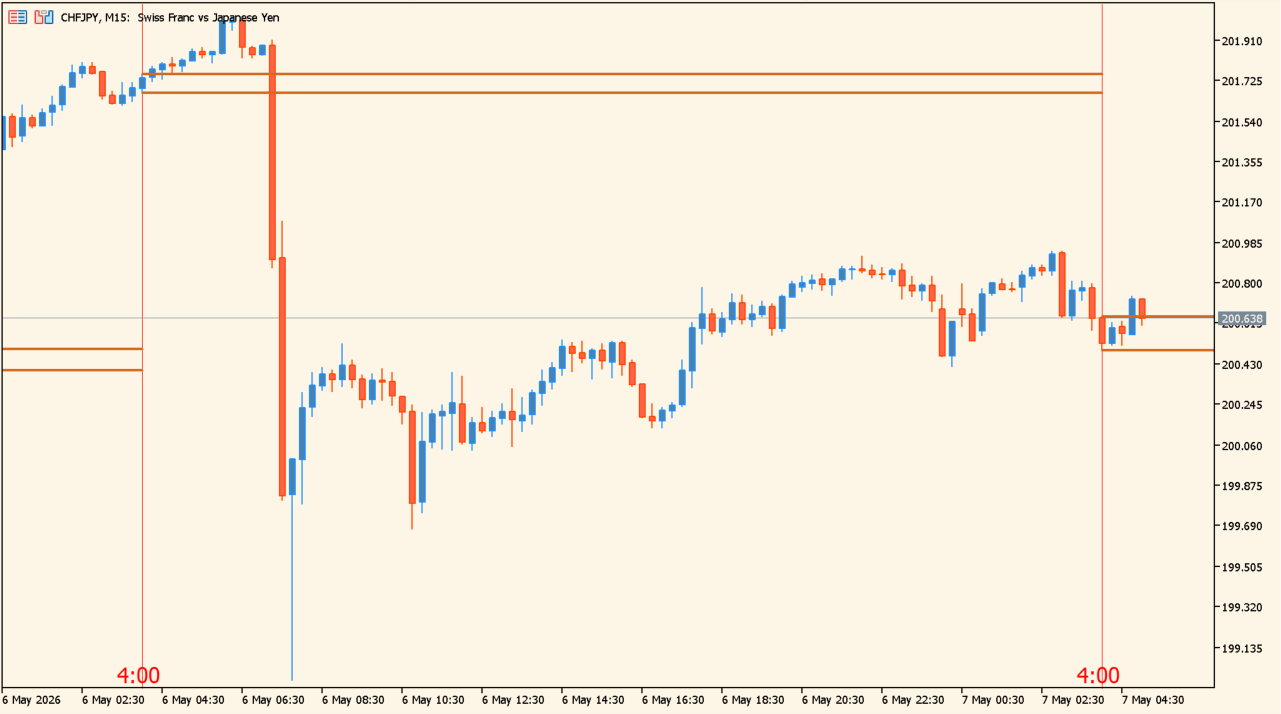
What is Time vLines with OHLC Lines?
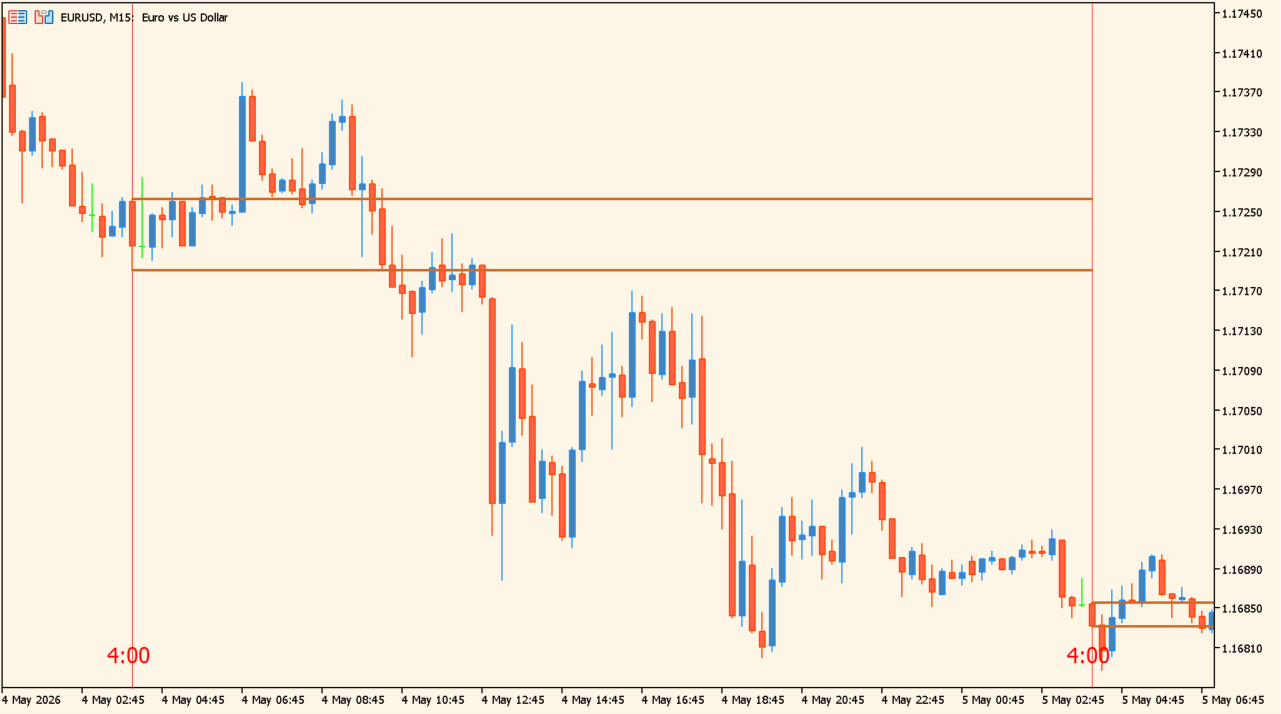
Time_vLines_with_OHLC_Lines puts a vertical line on the candle at an hour you choose and draws horizontal lines at that candle's high, low, open and close.
The vertical line is red and the price range of that candle is laid out as levels across the chart, which makes it plain which prices the market has been working around since. By default it marks the 04:00 candle on the 15-minute chart.
How to use Time vLines with OHLC Lines
Point it at the hours where the market actually moves: the Tokyo open, the London open, the New York open, the Tokyo fix, the London fix. The levels from that candle then show what price did afterwards relative to it, which suits breakout methods and studying how a session tends to behave.
Server time is not your local time, so set the hour accordingly. A typical MT5 server such as XM or Titan runs at GMT+3 in summer and GMT+2 in winter, while Japan is GMT+9, a difference of six hours in summer and seven in winter. To mark 09:00 Japan time you would therefore enter 03:00 in summer and 02:00 in winter. The timeframe, the reference hour, and the color, width and visibility of each line can all be changed.
Where it helps
Marking the London or New York open turns a vague sense of the session into levels you can measure price against.
Because the reference hour is a setting, the same levels can be applied backwards to check how a session usually behaves.
The vertical line and each of the four price lines can be turned on or off and restyled, so the chart carries only the levels you actually use.
MT5 Indicator Parameters
The table below lists the available MT5 indicator parameters. You can customize these options in the MetaTrader Inputs dialog to match your trading preferences.
| Parameter | Description |
|---|---|
| ID | Sets the identifier used when multiple instances of the indicator are displayed. |
| CandleDataTf | Sets the timeframe used as the candle data reference. |
| Hour_Num | Sets the hour at which the lines are drawn. |
| Minute_Num | Sets the minute at which the lines are drawn. |
| Line_Color | Sets the color of the vertical lines. |
| Plot_Labels | Shows or hides the price labels. |
| Label_Font_Size | Sets the label font size. |
| Description_Label | Sets the description label text. |
| PriceLines | Selects which OHLC lines are displayed. |
| OpenLineColor | Sets the color of the open line. |
| HighLineColor | Sets the color of the high line. |
| LowLineColor | Sets the color of the low line. |
| CloseLineColor | Sets the color of the close line. |
| PriceLineStyle | Sets the line style for the OHLC lines. |
| PriceLineWidth | Sets the line width for the OHLC lines. |
| MaxPlot_Tf | Sets the maximum timeframe on which the indicator is displayed. |
| WeekendMarket | Includes or excludes weekend market data from line drawing. |
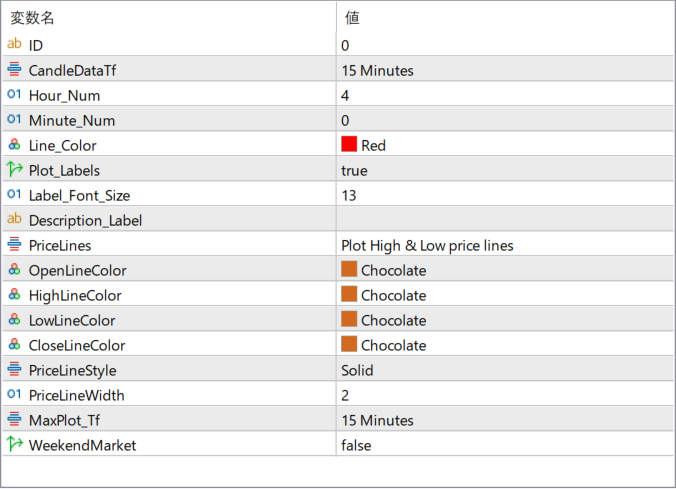
The screenshot above shows the default input parameters in the MT5 settings window.
How to Install .ex5 Indicator in MetaTrader 5
- Download the ZIP file and extract it.
- In MT5, select File → Open Data Folder.
- Open MQL5 → Indicators and copy the EX5 or MQ5 file into it.
- If the package includes library files, copy them to MQL5 → Libraries. Copy TPL files to the top-level templates folder.
- Restart MT5, find the indicator in the Navigator, and drag it onto a chart.
Test the tool on a demo account first. File contents and required folders can vary between packages.


