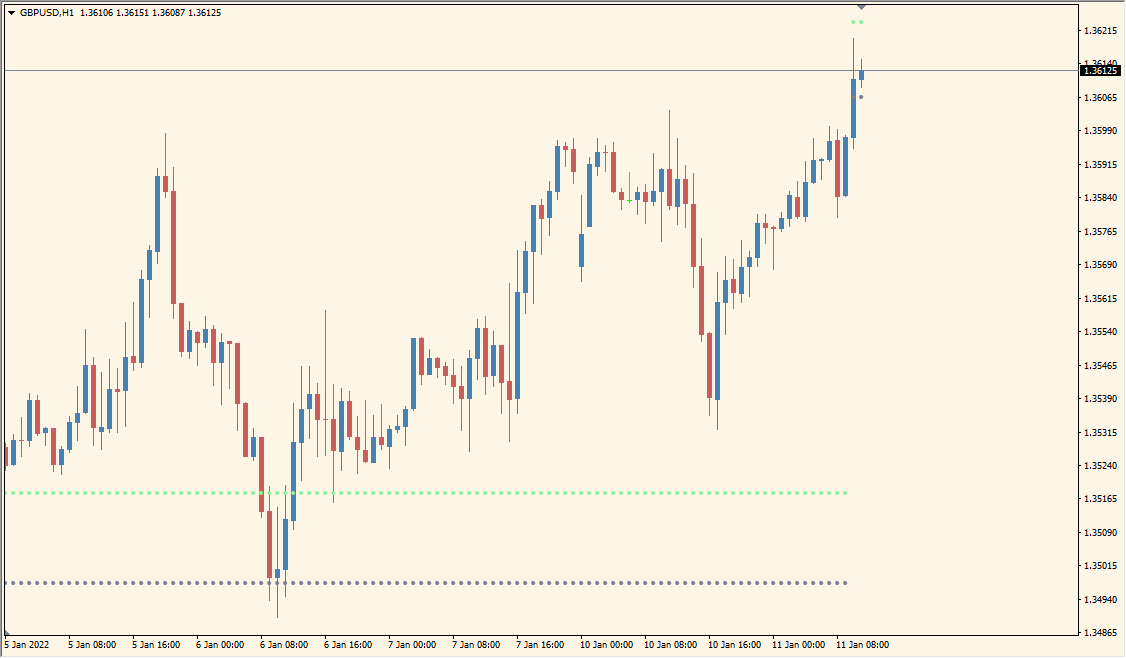
What is True Breakout Levels Indicator?
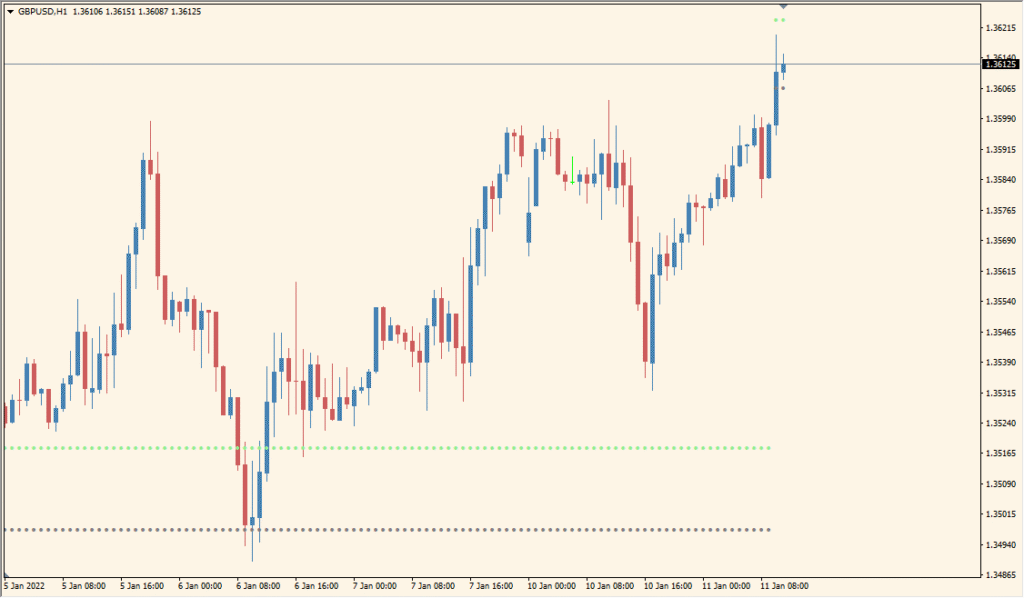
True Breakout Levels for MT4 automatically draws horizontal support and resistance lines. Orange lines are support, green lines are resistance, and gray lines are secondary levels.
Limit_Period controls how much history is used for the displayed lines. A smaller value produces more lines from shorter history windows, so the chart becomes denser.
How to Use It in Practice
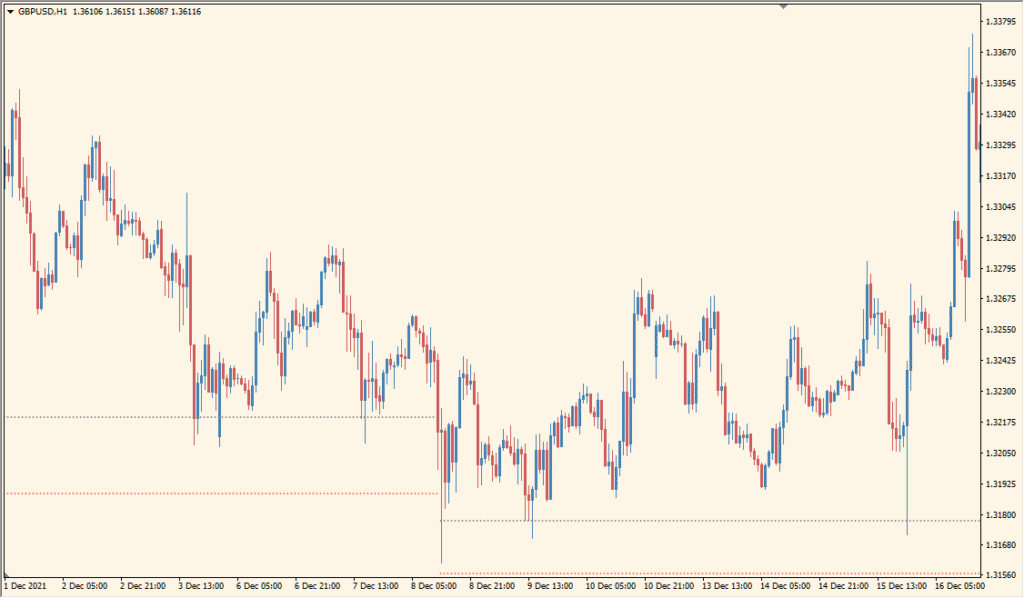
True Breakout Levels draws orange support lines, green resistance lines, and gray secondary levels. The lines are an automatically calculated set over a relatively long history, with the colors separating the displayed groups.
- Read the orange, green, and gray lines with the nearby highs, lows, and closing candles rather than as unlabeled identical levels.
- Decrease Limit_Period to draw more lines from shorter history windows.
- Check the resulting density on the chosen symbol, because a smaller Limit_Period also produces more misleading-looking lines.
Historical price clusters are converted into visible zones, the lookback period is configurable, and styling settings help keep the level display readable.
MT4 Indicator Parameters
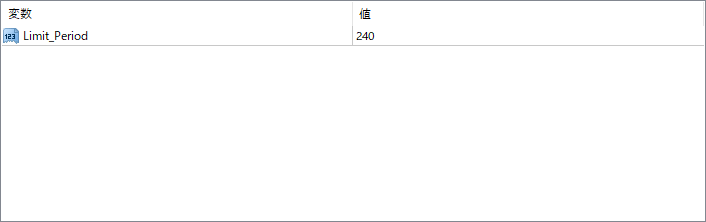
The screenshot above shows the default input parameters in the MT4 settings window.
| Parameter | Description |
|---|---|
| Limit_Period | Controls how many past candles are analyzed to generate breakout levels. A higher value means the indicator looks further back in history, which may produce stronger but fewer levels. A smaller value focuses on more recent price action and can produce more responsive levels. |


