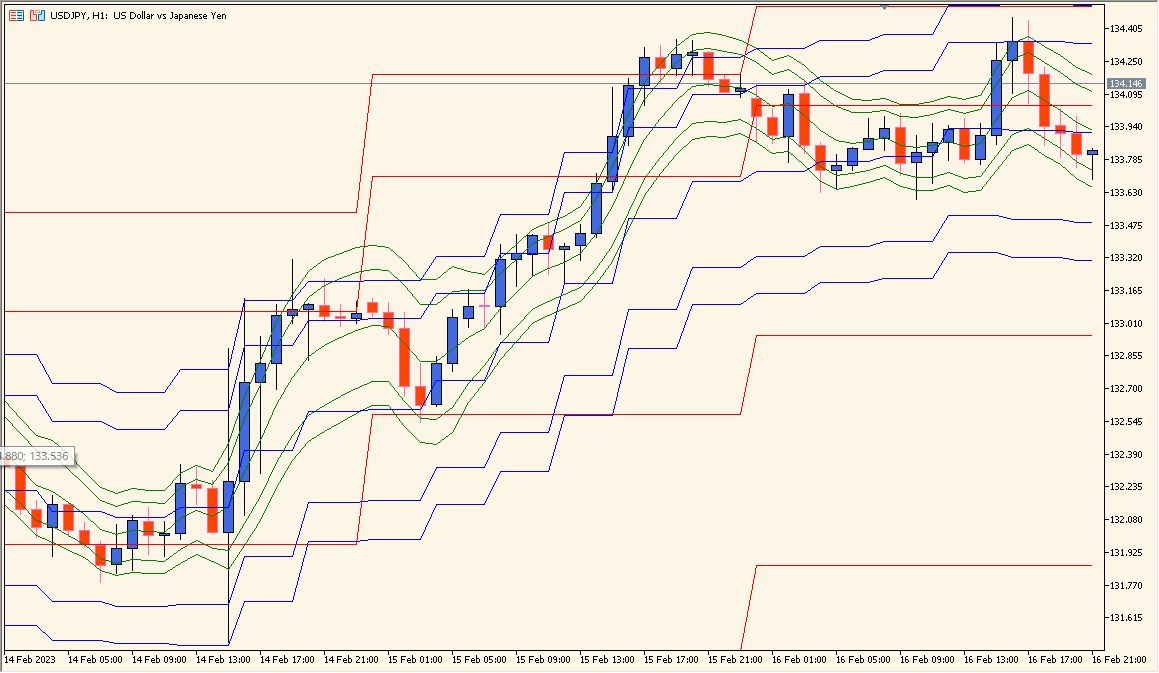
What is Tymen STARCBands MTF Indicator?
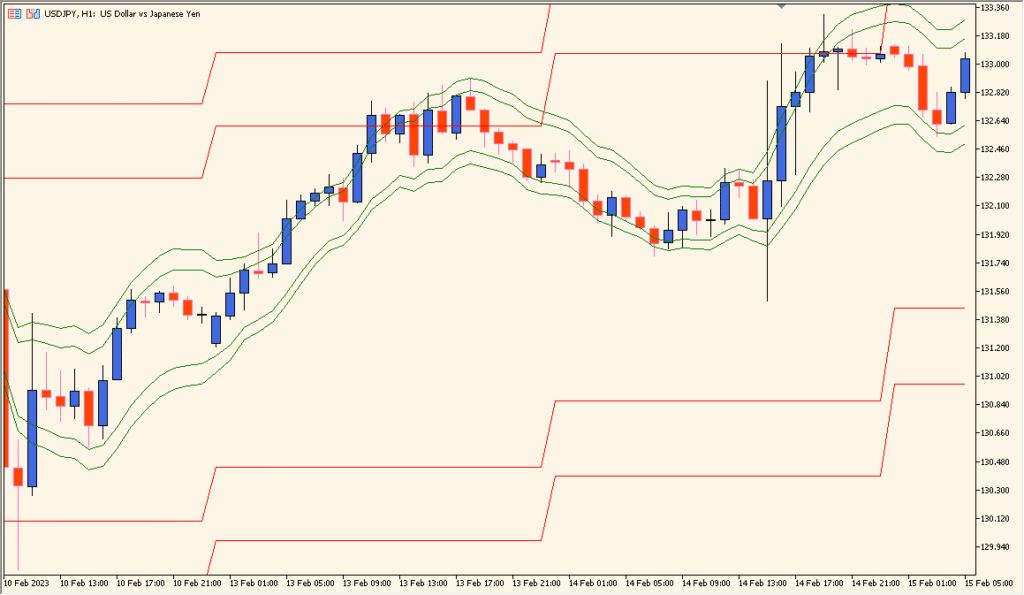
Tymen STARCBands MTF is an MT5 chart indicator that displays STARC-style bands around moving averages for selected timeframes. Average periods, ATR settings, timeframe choices, colors, and line styles control the layered view.
The bands provide visual context for comparing price location with ranges measured across chart horizons. They are reference boundaries for review and do not establish a fixed reaction.
How to Use It in Practice
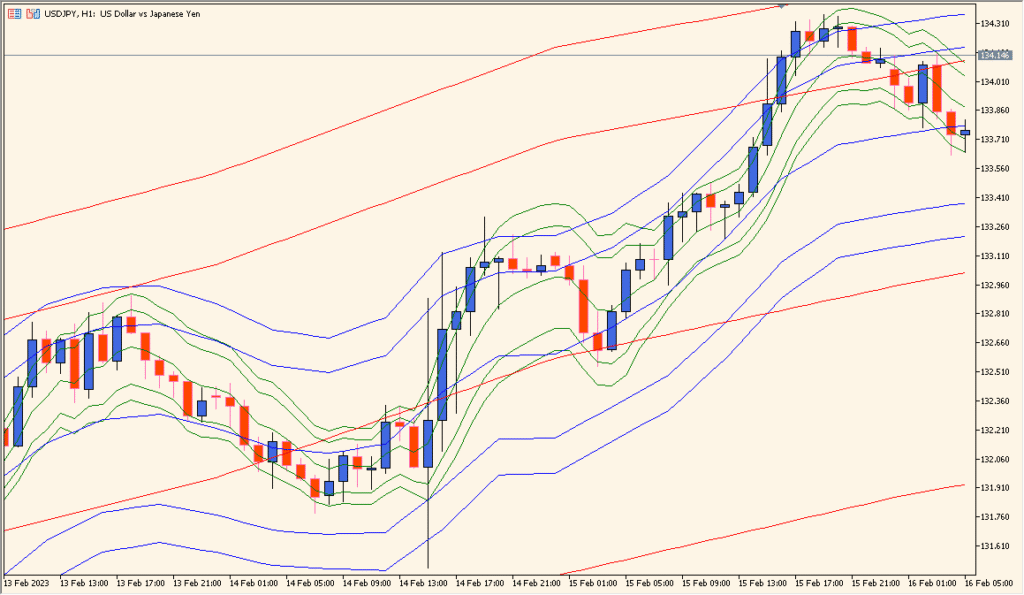
Separate the three STARC Band layers around their moving averages, then decide which layers should remain visible before comparing their spacing:
- Use Show middle lines, Show second Tymen STARC Bands, and Show third Tymen STARC Bands to reduce the number of visible layers when the chart becomes crowded.
- Switch Drawing mode from steps to slope when a smoother line rendering is needed.
- Compare the remaining band layers and their ATR-based spacing across the selected timeframes.
MT5 Indicator Parameters
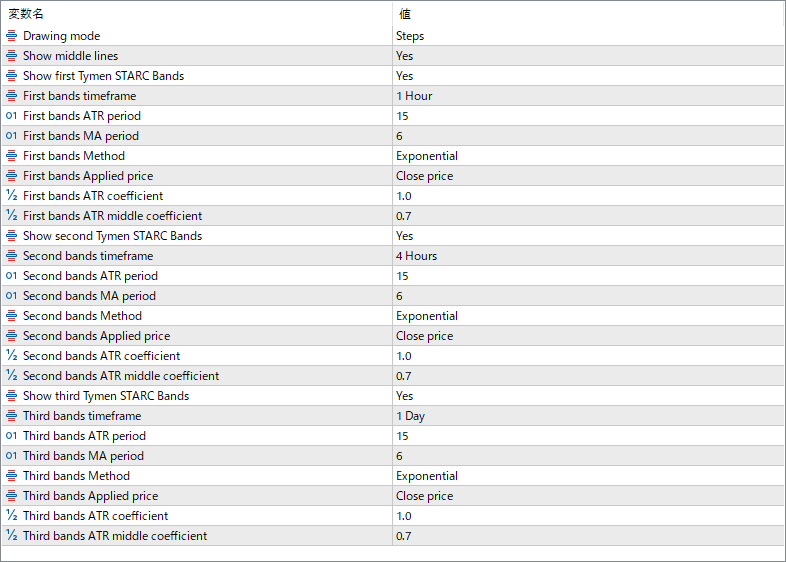
The screenshot above shows the default input parameters in the MT5 settings window.
| Parameter | Description |
|---|---|
| Drawing mode | Sets how the bands are drawn on the chart. “Steps” mode creates horizontal steps between updates for a cleaner MTF display. |
| Show middle lines | Enables or disables the display of the Moving Average center line for each band set. |
| Show first Tymen STARC Bands | Toggles visibility for the first (base) STARC band group. |
| First bands timeframe | Defines the timeframe used for the first band calculation (e.g., 1 Hour). |
| First bands ATR period | Number of bars used for ATR calculation that determines volatility width. |
| First bands MA period | Number of bars for the Moving Average used as the central line of the bands. |
| First bands Method | Type of Moving Average used (e.g., Exponential, Simple). |
| First bands Applied price | Defines which price is used for the Moving Average (e.g., Close, Open, Median). |
| First bands ATR coefficient | Multiplier for ATR to set the outer band distance from the MA line. |
| First bands ATR middle coefficient | Multiplier for ATR to draw the inner or middle band lines between the MA and outer limits. |
| Show second Tymen STARC Bands | Turns on or off the second (higher timeframe) band group for multi-timeframe comparison. |
| Second bands timeframe | Sets the timeframe for the second STARC bands (e.g., 4 Hours). |
| Second bands ATR period | Defines how many bars are used to measure volatility on the second timeframe. |
| Second bands MA period | Number of bars used for the Moving Average calculation on the second timeframe. |
| Second bands Method | Moving Average type for the second timeframe (e.g., Exponential). |
| Second bands Applied price | Defines which price data is used for the second MA and bands. |
| Second bands ATR coefficient | ATR multiplier for outer band distance on the second timeframe. |
| Second bands ATR middle coefficient | Multiplier used for drawing inner mid-level bands on the second timeframe. |
| Show third Tymen STARC Bands | Displays or hides the third (typically highest timeframe) STARC band group. |
| Third bands timeframe | Defines the timeframe used for the third STARC band calculation (e.g., 1 Day). |
| Third bands ATR period | Sets the number of bars used for the ATR volatility calculation for the third timeframe. |
| Third bands MA period | Determines how many bars are used for the central Moving Average line on the third timeframe. |
| Third bands Method | Type of Moving Average for the third band set. |
| Third bands Applied price | Specifies which price is used to calculate the Moving Average and bands. |
| Third bands ATR coefficient | Multiplier that adjusts the distance of the outer bands for the third timeframe. |
| Third bands ATR middle coefficient | Multiplier that controls the distance for inner mid-bands on the third timeframe. |


