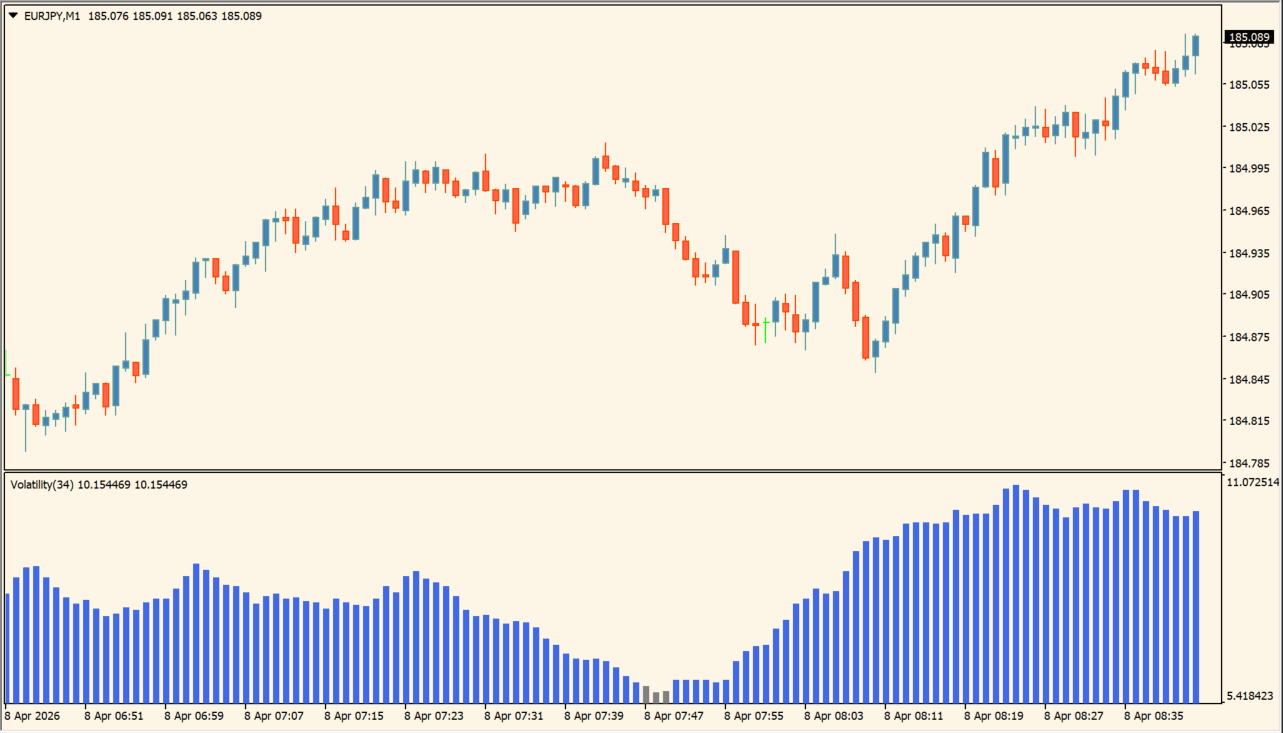
What is Volatilityy Indicator 2?
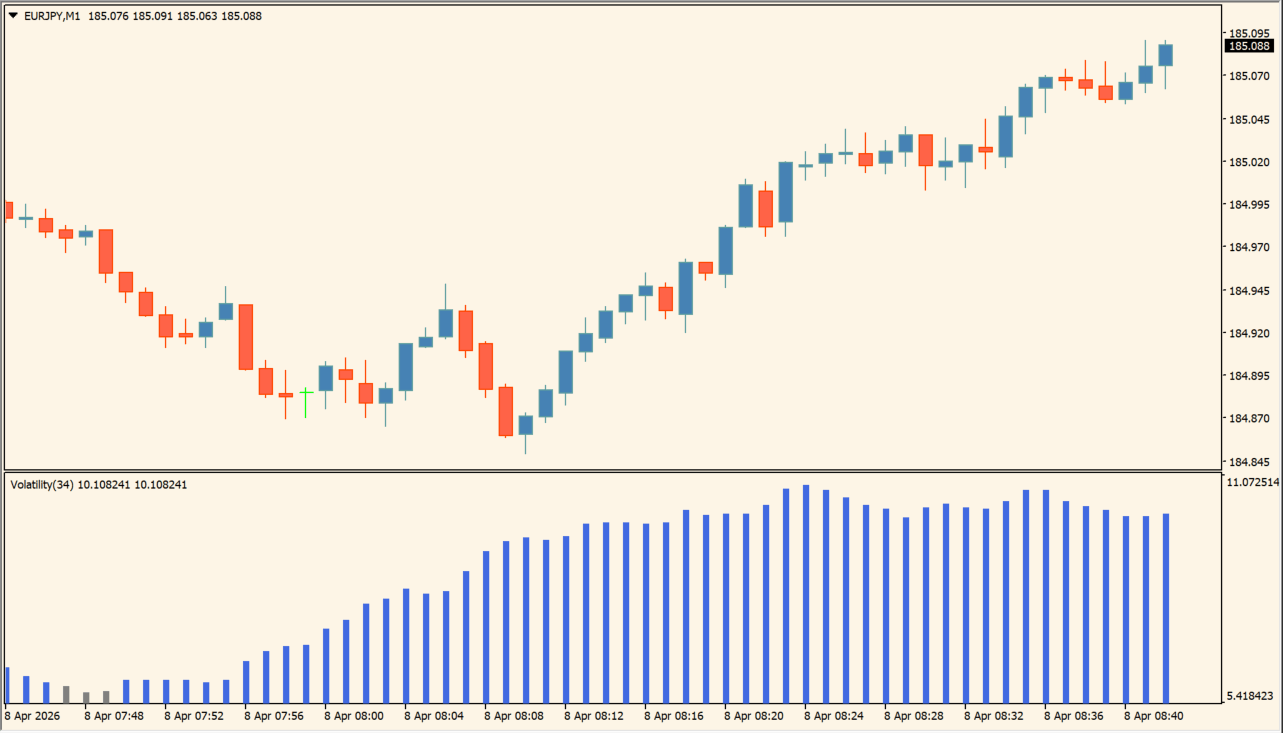
Volatilityy Indicator 2 measures recent price-range movement and displays it as a histogram below the MT4 price chart. Bar height provides a compact view of how the selected range changes through time.
The package includes an .ex4 file. The histogram is a visual range reference and does not establish a future direction or outcome.
How to use Volatilityy Indicator 2
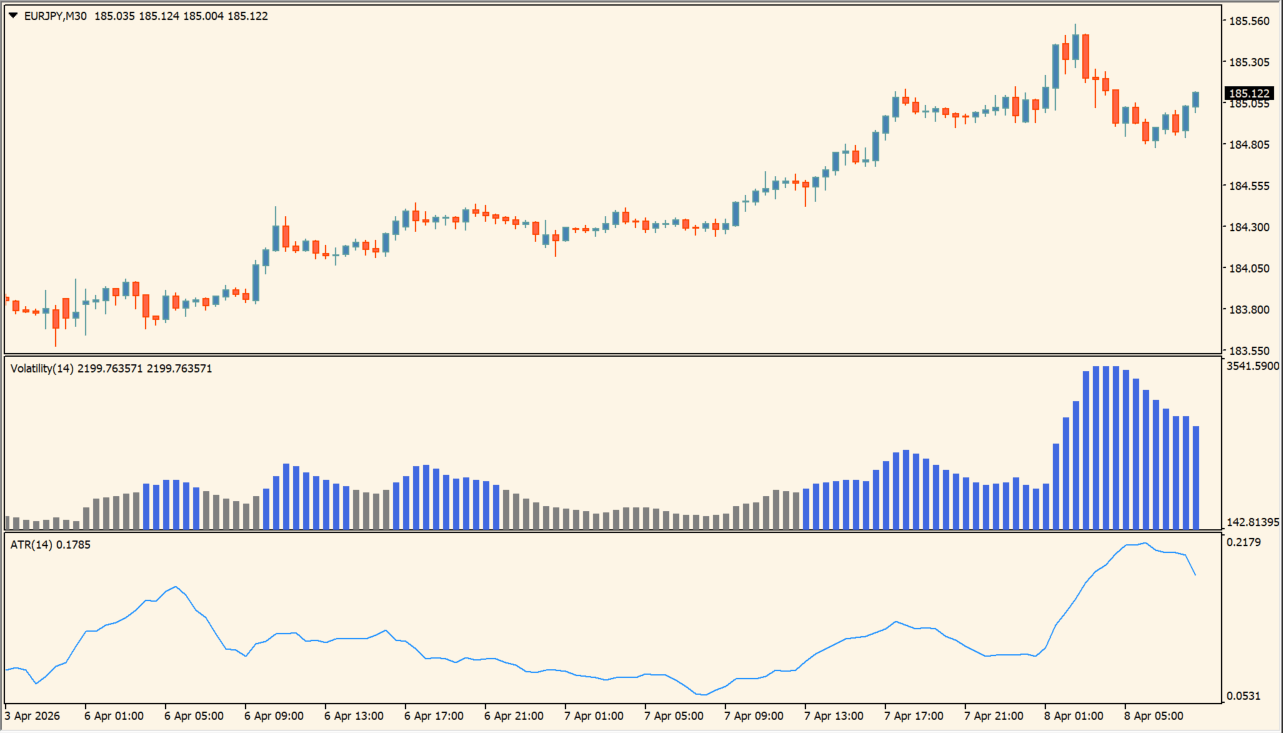
Compare histogram height with the main chart and the recent candle ranges. Expanding or contracting bars can be reviewed as context for the amount of movement represented by the selected period.
MaPriod controls the averaging window and value controls the secondary display setting. The defaults are 34 and 0.5.
Where it helps
A separate histogram makes changing movement easier to compare.
Bar height provides a consistent visual record of recent range.
The display exposes only the two verified inputs.
MT4 Indicator Parameters
The table below lists the available MT4 indicator parameters. You can customize these options in the MetaTrader Inputs dialog to match your trading preferences.
| Parameter | Description |
|---|---|
| MaPriod | Sets the averaging period for the range calculation. Default: 34. |
| value | Sets the secondary value used by the display. Default: 0.5. |
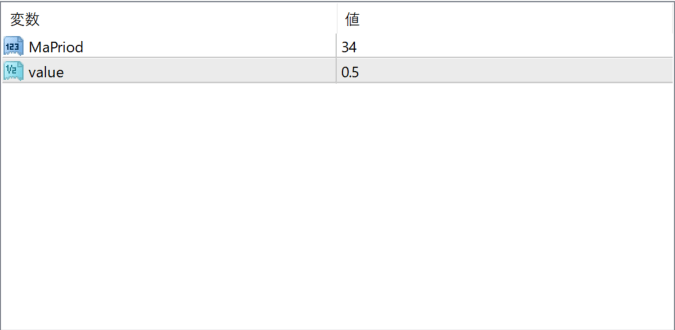
The screenshot above shows the default input parameters in the MT4 settings window.
How to Install .ex4 Indicator in MetaTrader 4
- Download the ZIP file and extract it.
- In MT4, select File → Open Data Folder.
- Open MQL4 → Indicators and copy the EX4 or MQ4 file into it.
- If the package includes library files, copy them to MQL4 → Libraries. Copy TPL files to the top-level templates folder.
- Restart MT4, find the indicator in the Navigator, and drag it onto a chart.
Test the tool on a demo account first. File contents and required folders can vary between packages.


