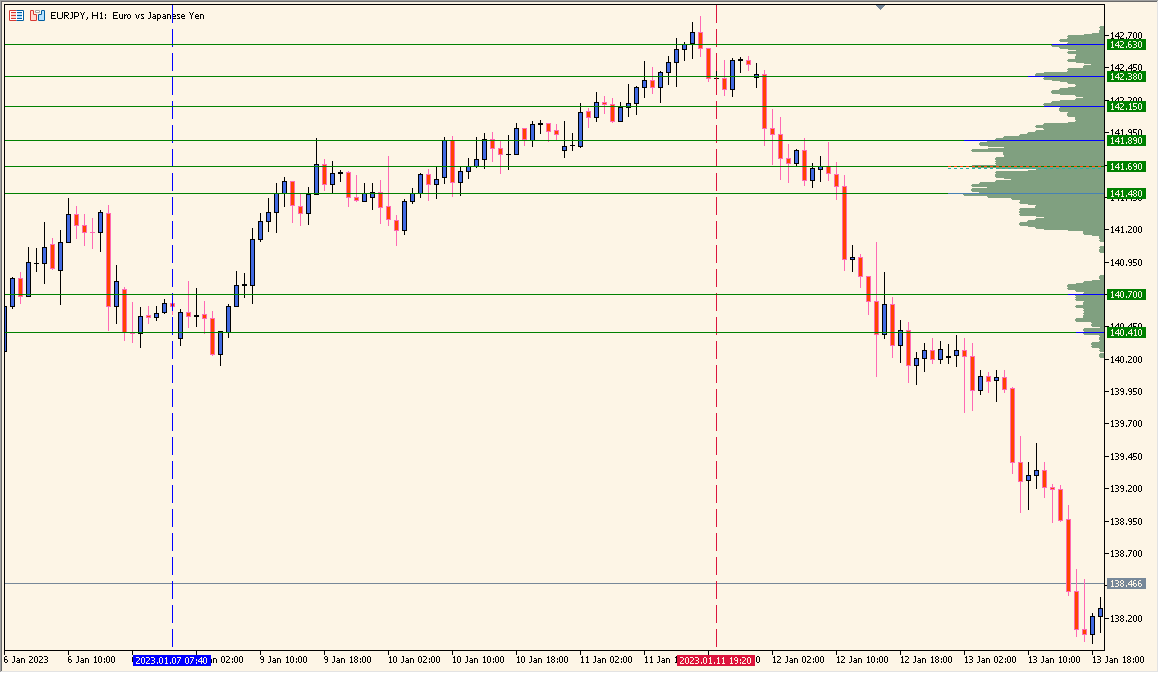
What is VP-Range-v6 Indicator?
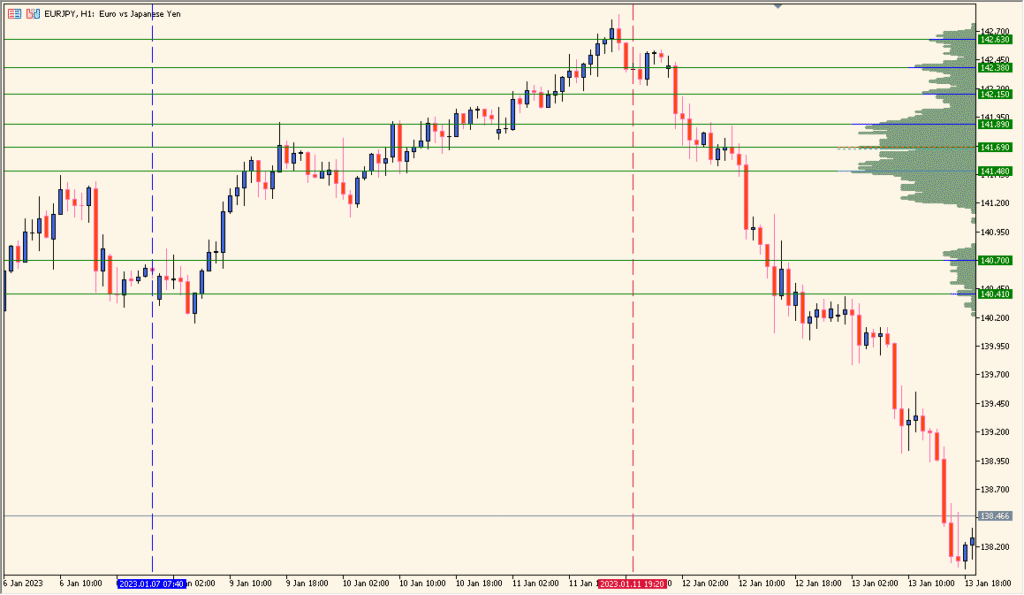
VP-Range-v6 is an MT5 volume-profile display that distributes available volume across price levels inside a selected range. Range dates, row steps, data source, colors, and profile style settings control the chart view.
The profile shows where the selected sample contains more or less displayed activity. It provides market-structure context for comparison and does not identify a fixed reaction area.
How to Use It in Practice
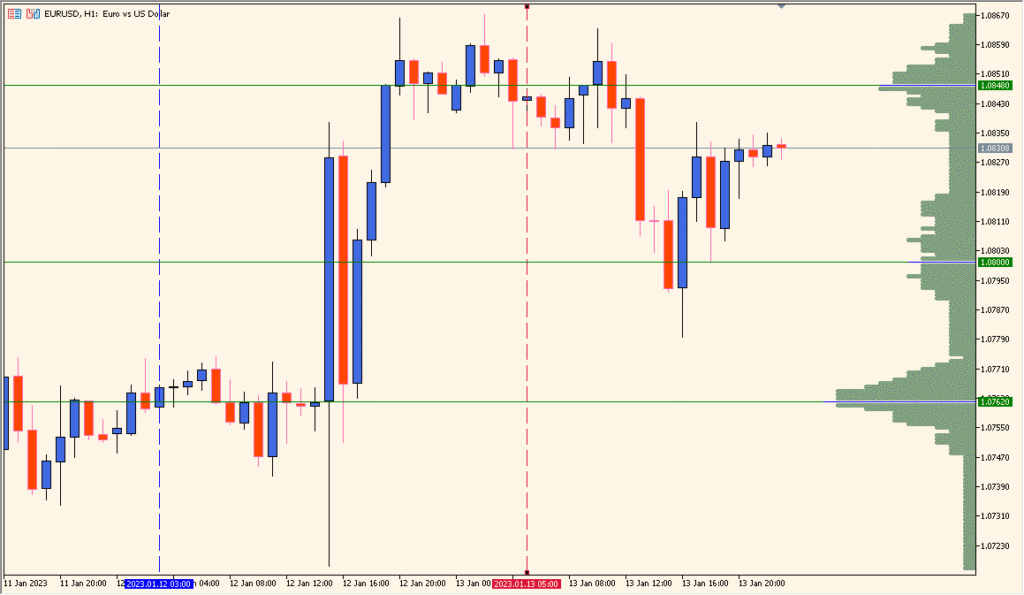
Position the two vertical lines around the sample to be counted, then read the horizontal histogram that the indicator draws between those boundaries:
- Double-click a vertical line before moving it to change the selected calculation range.
- Compare the longer histogram rows with the range-bound candle sections and the shorter rows with more directional sections.
- This profile counts price movement rather than providing consolidated exchange volume for FX.
Volume is organized by price level, range settings define the sample being reviewed, and profile styling keeps the distribution legible.
MT5 Indicator Parameters
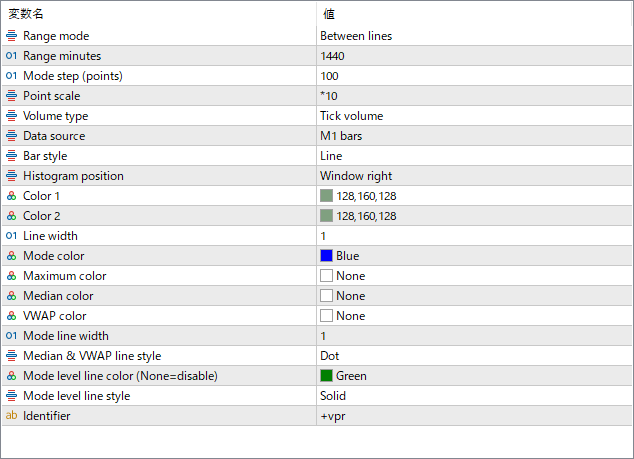
The screenshot above shows the default input parameters in the MT5 settings window.
| Parameter | Description |
|---|---|
| Range mode | Defines how the profile range is selected — for example, between two vertical lines or fixed periods. |
| Range minutes | Specifies the time duration (in minutes) that the indicator uses to calculate the profile. |
| Mode step (points) | Sets the price step or resolution for building the volume histogram. |
| Point scale | Adjusts the horizontal scaling of the histogram bars to control their visual width. |
| Volume type | Chooses whether the profile is based on tick volume or real volume (depending on broker data). |
| Data source | Selects the data interval used for volume calculation, such as M1 bars for higher precision. |
| Bar style | Determines how the histogram bars are drawn — for example, as lines or filled shapes. |
| Histogram position | Defines where the profile is displayed on the chart (e.g., right side or left side of the window). |
| Color 1 / Color 2 | Sets the gradient or alternating colors of the histogram bars for visual contrast. |
| Mode color | Specifies the color of the mode (the price level with the highest volume). |
| Maximum color | Defines the color used to highlight the absolute maximum volume level, if enabled. |
| Median color | Sets the color for the median volume level across the selected range. |
| VWAP color | Specifies the color of the VWAP (Volume Weighted Average Price) line, if displayed. |
| Line width | Adjusts the thickness of histogram outline lines. |
| Mode line width | Sets the width of the line marking the mode (highest volume) level. |
| Median & VWAP line style | Defines the visual style (e.g., dotted or solid) for median and VWAP lines. |
| Mode level line color | Sets the color of the horizontal level line at the mode price. If set to “None,” the line is hidden. |
| Mode level line style | Specifies the line style used for the mode level (solid, dashed, etc.). |
| Identifier | Used internally to differentiate multiple instances of the indicator on the same chart. |


