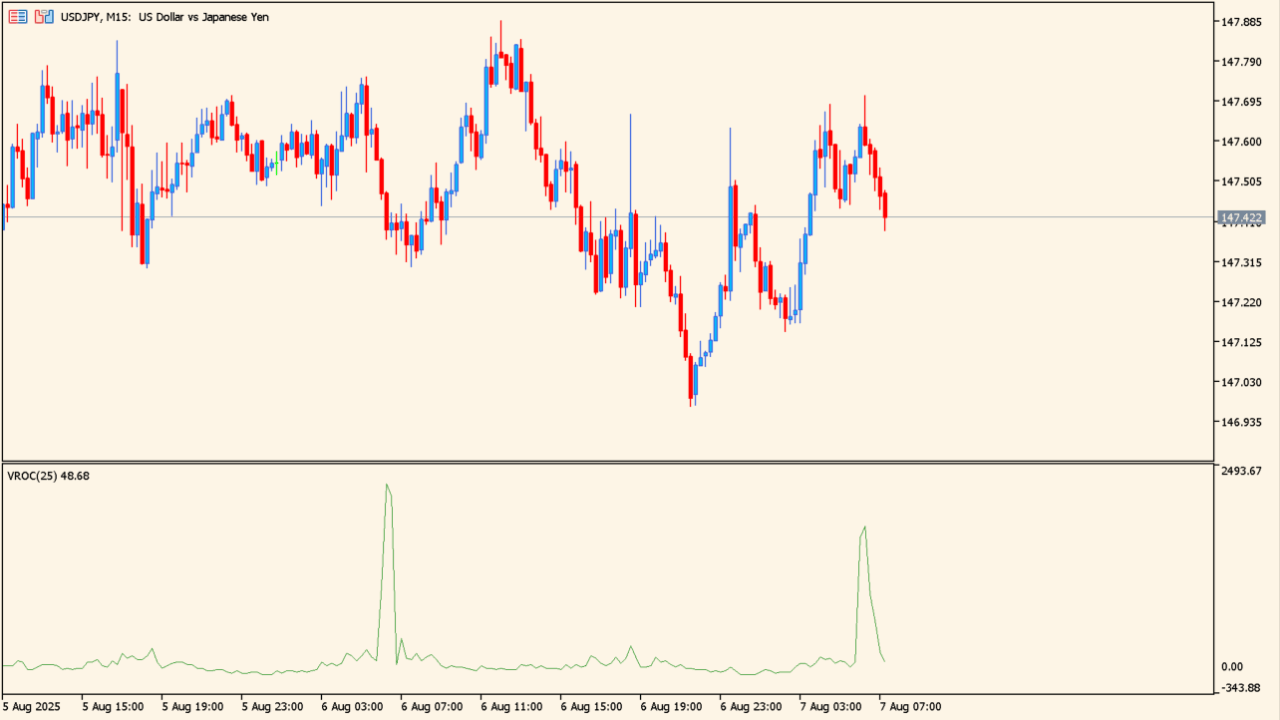
What is VROC?
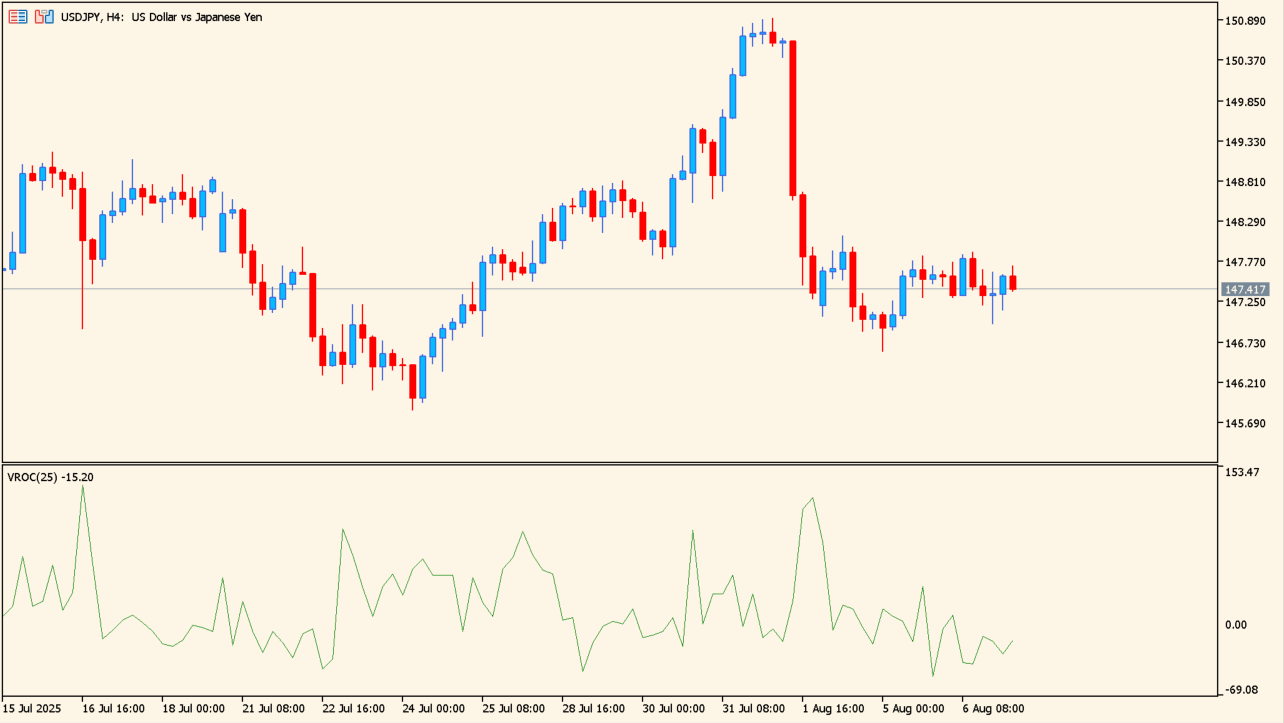
VROC is a lower-chart line that shows the percentage change between current volume and volume from a selected past period. Larger values indicate a sharp increase in volume, while a rapid fall can accompany market stagnation.
How to use VROC
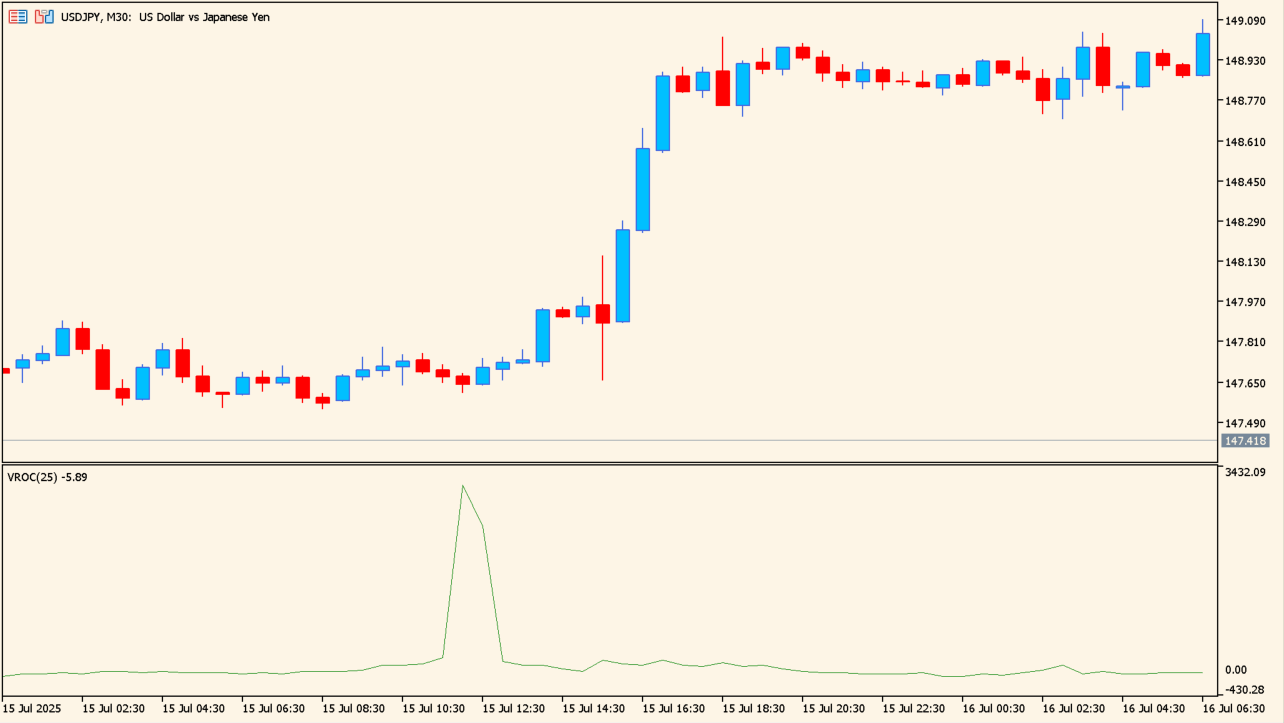
VROC shows the percentage change between current volume and volume from a selected earlier period. It is drawn as a line in the lower chart window, where larger values show a sharper increase in volume. On shorter timeframes, the line can rise rapidly before sudden price movement. A rapid decline can accompany market stagnation or a continuing range.
Where it helps
MT5 Indicator Parameters
The table below lists the available MT5 indicator parameters. You can customize these options in the MetaTrader Inputs dialog to match your trading preferences.
| Parameter | Description |
|---|---|
| Period | Sets the period used to calculate the change in volume. |
| Volumes | Selects the volume type used for the calculation. |
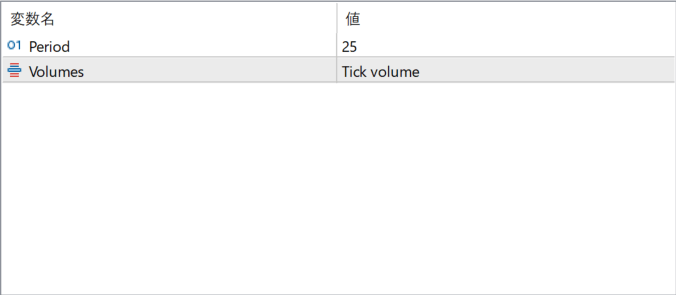
The screenshot above shows the default input parameters in the MT5 settings window.
How to Install .ex5 Indicator in MetaTrader 5
- Download the ZIP file and extract it.
- In MT5, select File → Open Data Folder.
- Open MQL5 → Indicators and copy the EX5 or MQ5 file into it.
- If the package includes library files, copy them to MQL5 → Libraries. Copy TPL files to the top-level templates folder.
- Restart MT5, find the indicator in the Navigator, and drag it onto a chart.
Test the tool on a demo account first. File contents and required folders can vary between packages.


