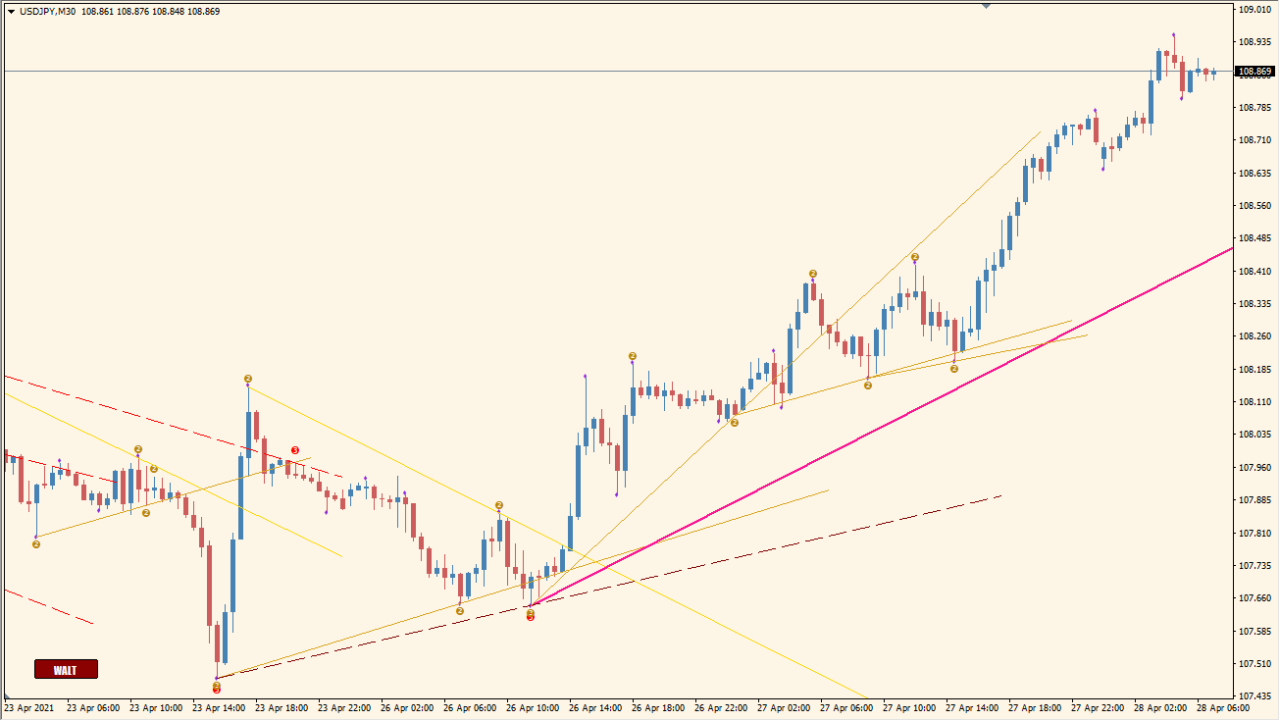
What is WATL-Open Source button Indicator?
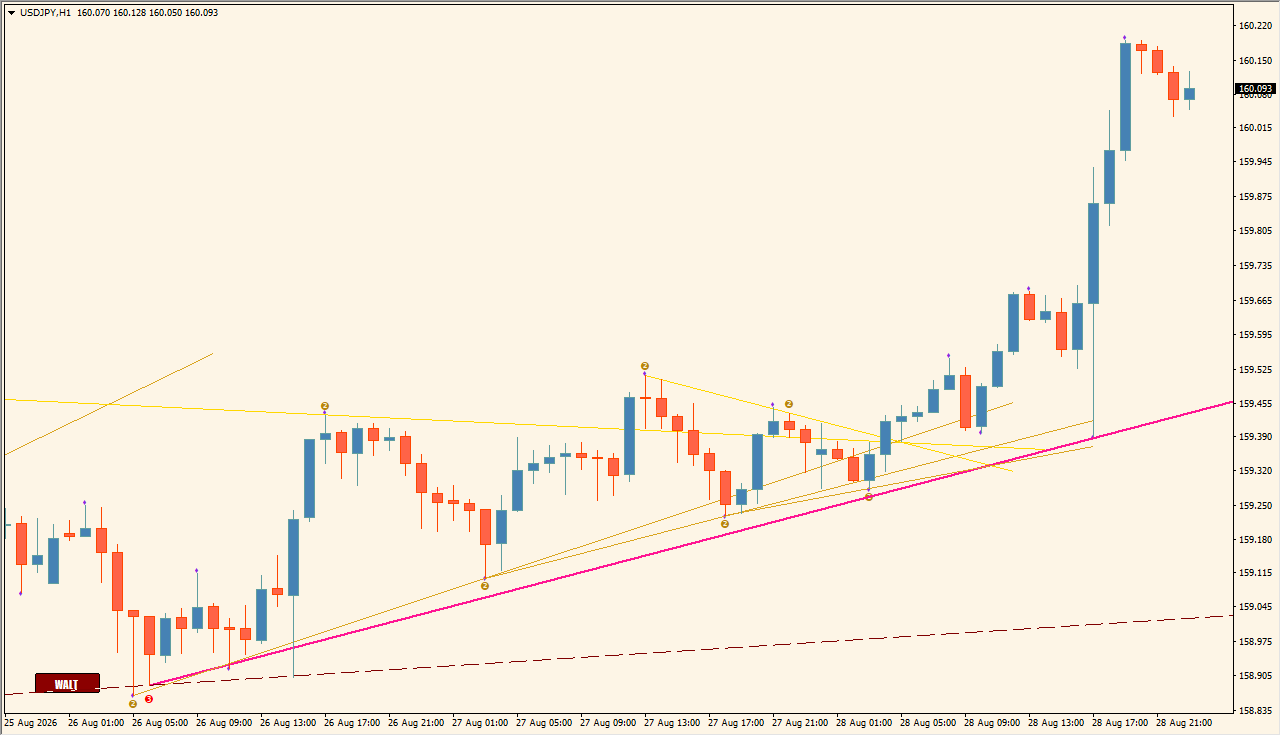
WATL Open Source Button is an MT4 indicator that marks high and low pivot points with semafor dots and draws trendlines from those chart structures. The available settings cover pivot sensitivity, line display, colors, widths, extensions, and alerts.
Use the plotted points and lines as visual references for reviewing market structure and price behavior. The indicator organizes chart information but does not establish a fixed market outcome.
How to Use It in Practice
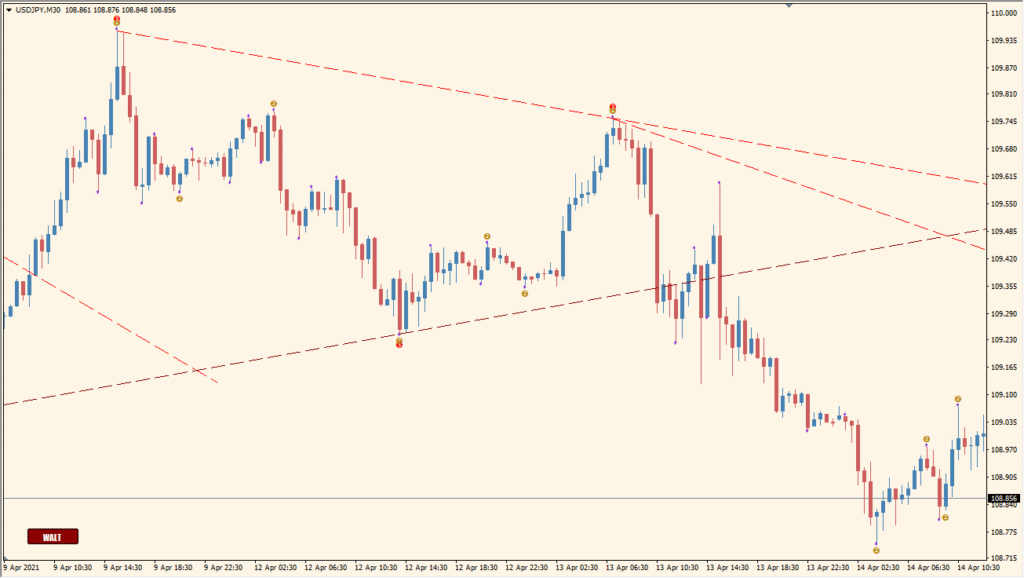
Separate WATL's three automatic trendline groups before reviewing the chart: red dotted lines mark long-term lines, yellow solid lines mark short-term lines, and thick pink lines mark the currently emphasized. The lower-left button controls the whole display.
- Use the lower-left button to show or hide the line set, then compare the three line styles with the candle structure.
- Increase HighPeriod, Low_Period, or Trigger_Sens to make the line selection use larger swings.
- Turn off the optional small dots and numbers when they obscure the chart to improve readability.
Semafor markers make pivot areas easier to locate, trendlines provide a compact view of displayed chart structure, and configurable styles and alerts support different review preferences.
MT4 Indicator Parameters
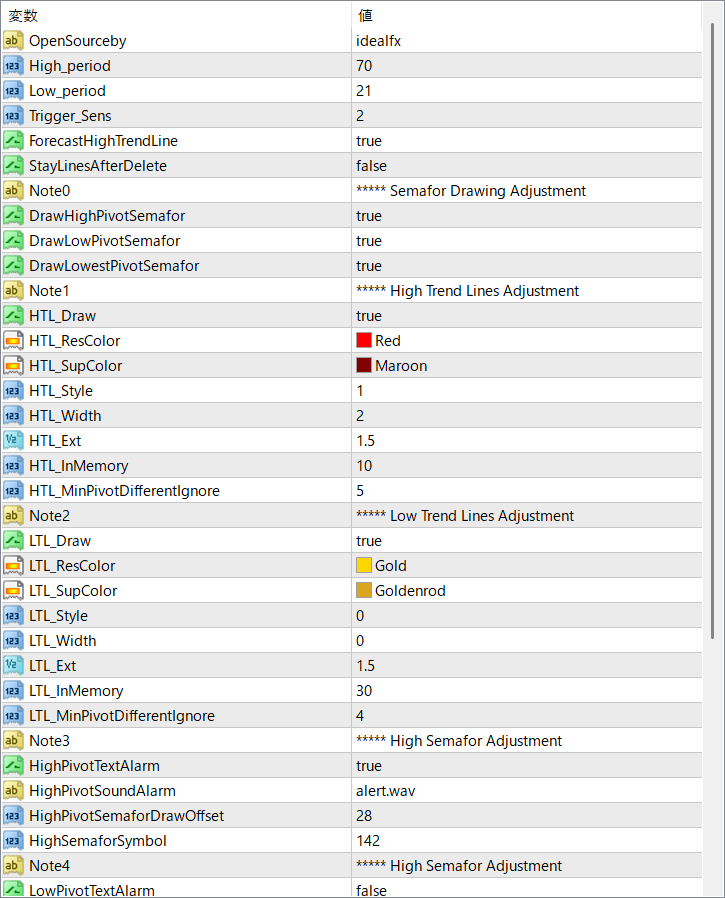
The screenshot above shows the default input parameters in the MT4 settings window.
| Parameter | Description |
|---|---|
| OpenSourceby | Name of the developer or source attribution. No functional impact. |
| High_period | Period used to calculate high pivot points. Larger values reduce sensitivity, showing fewer signals. |
| Low_period | Period used to calculate low pivot points. Functions the same way as High_period but for lows. |
| Trigger_Sens | Sensitivity setting for triggering semafor signals. Lower values increase the number of signals. |
| ForecastHighTrendLine | Enables drawing of forecasted trendlines from high pivots. |
| StayLinesAfterDelete | Determines whether trendlines stay on chart after deleting the indicator. |
| DrawHighPivotSemafor | Enables drawing of semafor dots at high pivot points. |
| DrawLowPivotSemafor | Enables drawing of semafor dots at low pivot points. |
| DrawLowestPivotSemafor | Shows the lowest-level semafor point for extra confirmation. |
| HTL_Draw | Turns on or off the drawing of high trendlines. |
| HTL_ResColor | Color used for resistance (high) trendlines. |
| HTL_SupColor | Color used for support trendlines, even if drawn from highs. |
| HTL_Style | Line style for high trendlines (solid, dashed, etc.). |
| HTL_Width | Line thickness for high trendlines. |
| HTL_Ext | Specifies how far the trendline is extended visually. |
| HTL_InMemory | Defines how many past bars to consider for trendline drawing. |
| HTL_MinPivotDifferentIgnore | Filters out pivot points that are too close together, reducing noise. |
| LTL_Draw | Enables or disables drawing of low trendlines. |
| LTL_ResColor | Color for resistance lines drawn from low pivots. |
| LTL_SupColor | Color for support lines drawn from low pivots. |
| LTL_Style | Line style used for low trendlines. |
| LTL_Width | Line thickness for low trendlines. |
| LTL_Ext | Length extension of the low trendline. |
| LTL_InMemory | Controls how much historical data is used for low pivots. |
| LTL_MinPivotDifferentIgnore | Minimum difference filter for low pivots to prevent over-drawing. |
| HighPivotTextAlarm | Turns on a text alert when a high semafor appears. |
| HighPivotSoundAlarm | Plays a sound alert when a high pivot is detected. |
| HighPivotSemaforDrawOffset | Controls the vertical offset of the high semafor marker from the candle. |
| HighSemaforSymbol | Symbol used to represent a high semafor on the chart (e.g., number or shape). |
| LowPivotTextAlarm | Turns on a text alert when a low semafor appears. |


