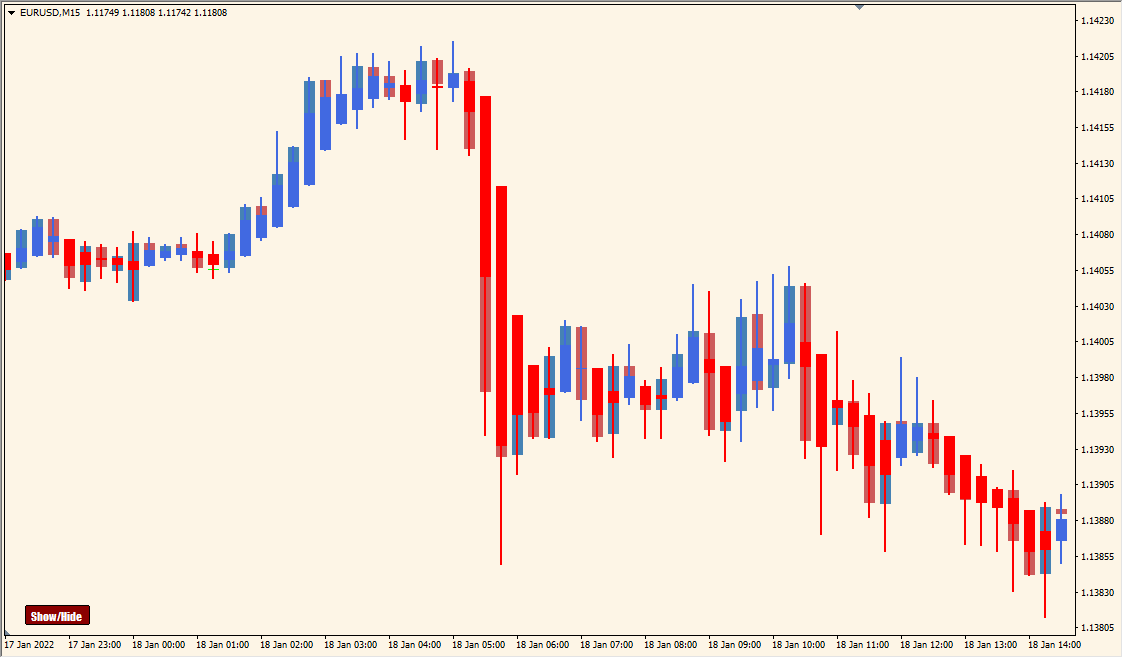
What is WyattsPivots_v2.1_w_toggle Indicator?
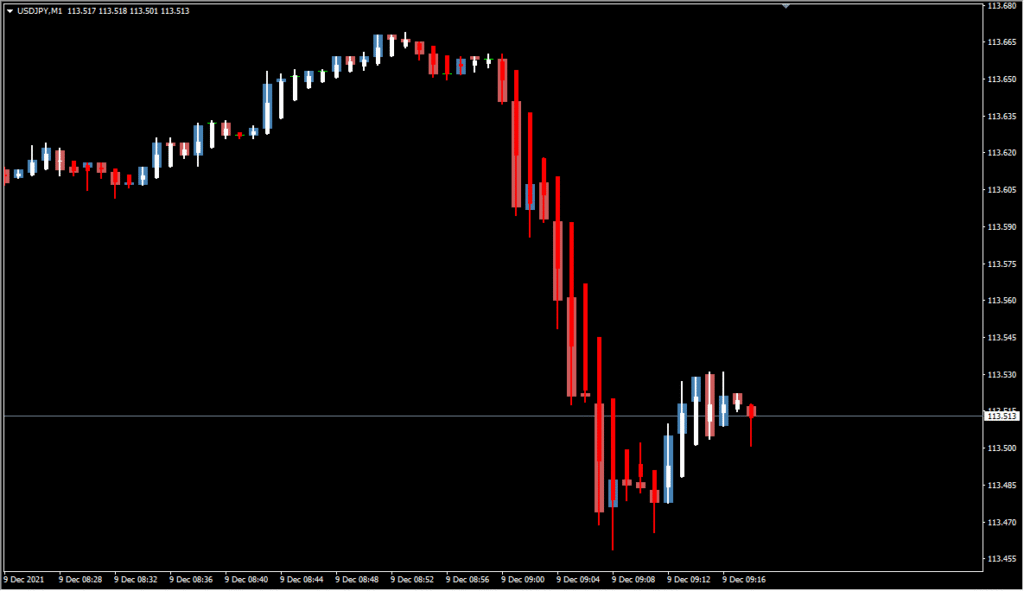
WyattsPivots v2.1 is an MT4 indicator that displays a central pivot with R1 to R3, S1 to S3, and optional midpoint lines. The display includes labels, configurable colors, line styles, widths, and an on-chart toggle button.
These calculated levels provide a consistent reference grid for reviewing daily chart context. They mark price levels for comparison without assuming that price will react at or reach any line.
How to Use It in Practice
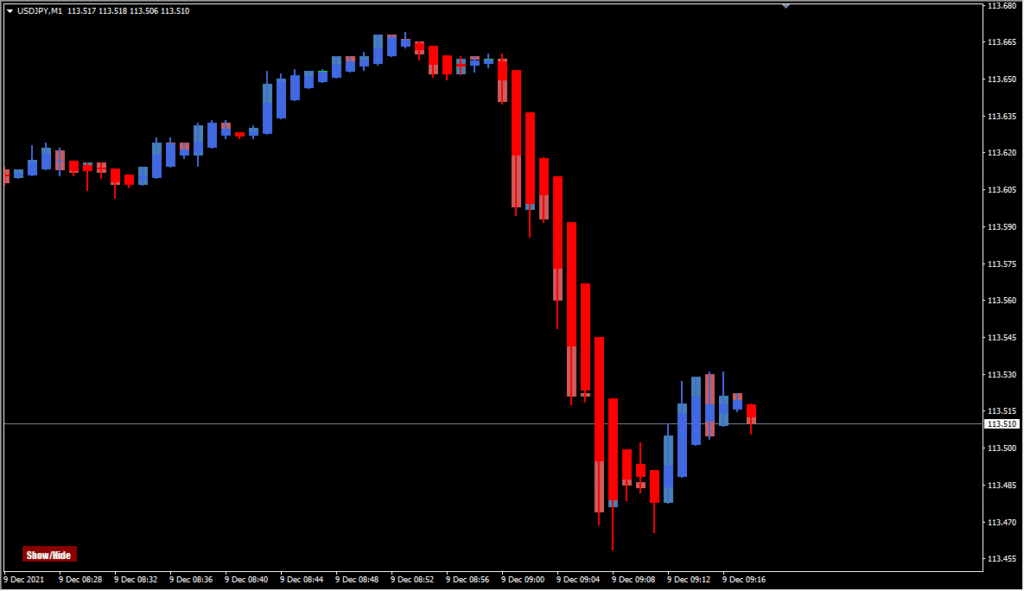
Read the three-day pivot layout as a group of central, blue, and red reference areas. iCountPeriods controls the number of displayed periods, iShittHours shifts the calculation time, and btn_show displays the visibility button.
- Set iCountPeriods to control how many days of pivot references remain visible before comparing the three groups.
- Use iShittHours only to align the calculation with the intended chart-time shift, then review the blue and red areas together with the central pivot structure.
- Set btn_show when the on-chart visibility button is needed and use the existing styles, colors, labels, and offsets to keep the groups distinct.
Several pivot and midpoint references appear in one grid, labels and colors keep the levels distinguishable, and the toggle helps reduce clutter during chart review.
MT4 Indicator Parameters
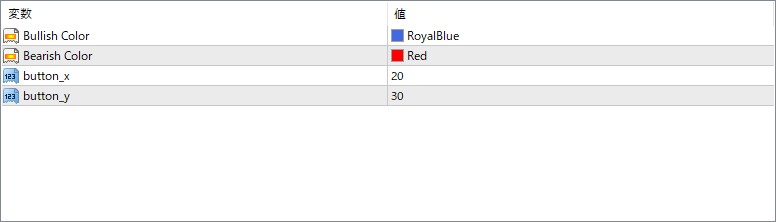
The screenshot above shows the default input parameters in the MT4 settings window.
| Parameter | Description |
|---|---|
| Show Mid Pivot Lines | Enables or disables the display of midpoints between the main pivot levels. |
| Pivot Width | Sets the thickness of the pivot lines displayed on the chart. |
| Pivot Style | Defines the line style of the pivot levels (e.g., solid, dashed, dotted). |
| Color Pivots | Sets the color used for the pivot point line. |
| Color R1/R2/R3 | Defines the color of each resistance line respectively (R1, R2, R3). |
| Color S1/S2/S3 | Defines the color of each support line respectively (S1, S2, S3). |
| Color Mid Pivots | Sets the color of the optional midpoint lines. |
| Show Toggle Button | Displays a toggle button on the chart to show/hide all pivot lines. |
| Toggle Corner | Sets the corner of the chart where the toggle button appears (e.g., top-left, bottom-right). |
| Label Color | Defines the color of the text labels for each pivot level. |
| Label Font Size | Sets the font size for pivot labels to ensure readability on different screen sizes. |
| Label Offset | Adjusts the horizontal or vertical offset of the pivot labels from the lines. |


