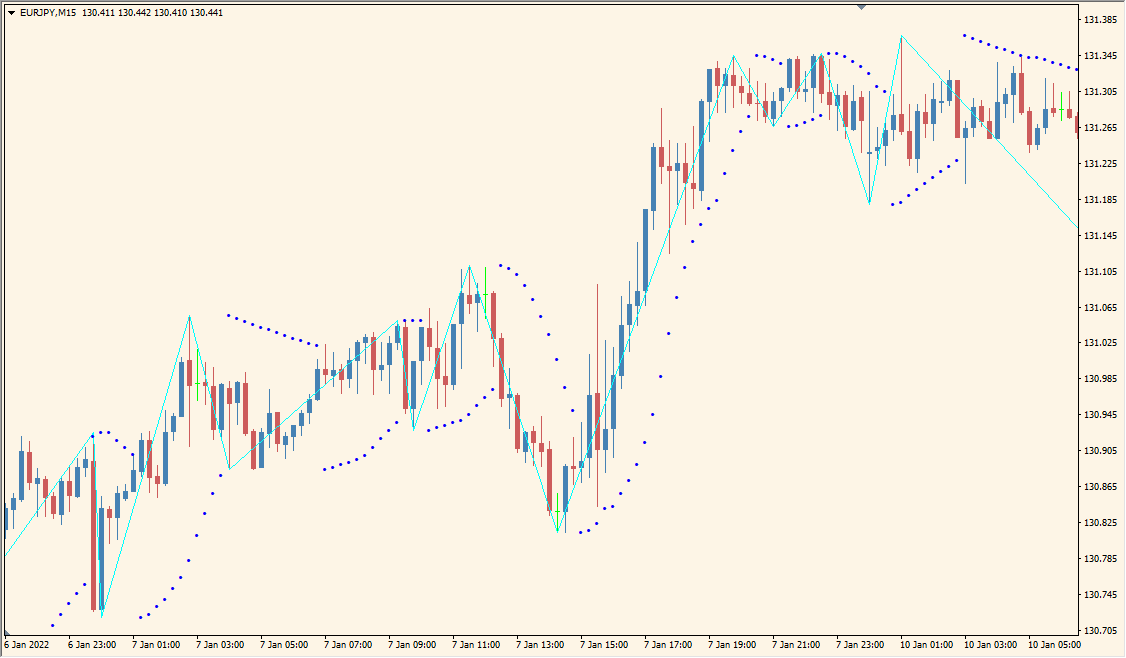
What is ZigZagOnParabolic Indicator?
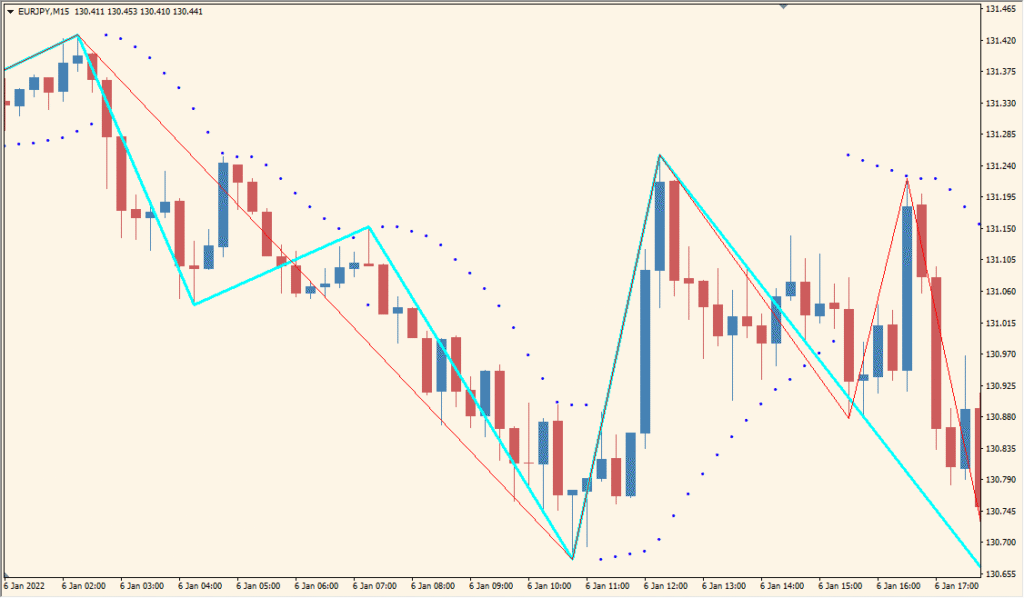
ZigZagOnParabolic for MT4 overlays ZigZag swing structure on Parabolic SAR dots. The combined display shows recent highs, lows, and PSAR direction in one chart view.
Step, Maximum, and ZigZag-related settings control the sensitivity and amount of swing structure shown. The overlay is intended for comparing turns with nearby support, resistance, and price movement.
How to Use It in Practice
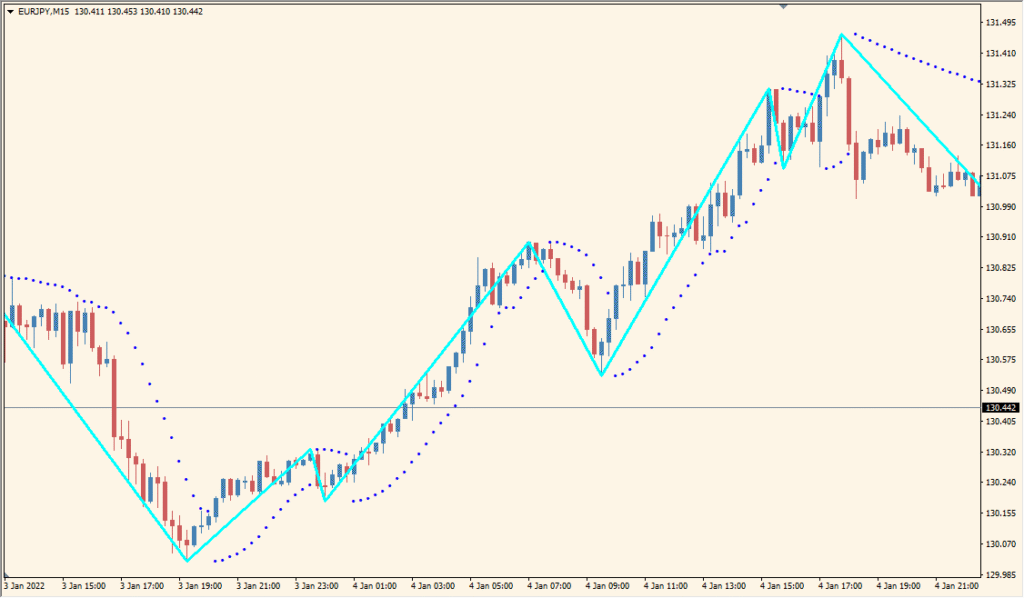
ZigZagOnParabolic layers a Parabolic-based swing line over the standard ZigZag. The standard ZigZag appears in red and the ZigZagOnParabolic line in light blue, so their turning points can be read side by side.
- Compare the red standard ZigZag and light-blue Parabolic-based line with the recent highs and lows on the chart.
- Increase Step to make the displayed waves finer, and adjust Maximum with it when required; Maximum has a smaller visible effect.
- Set History to limit the number of candles that receive the Parabolic display when chart rendering becomes heavy.
PSAR and ZigZag references share one chart, core sensitivity settings are adjustable, and the combined structure makes recent turns easier to compare.
MT4 Indicator Parameters
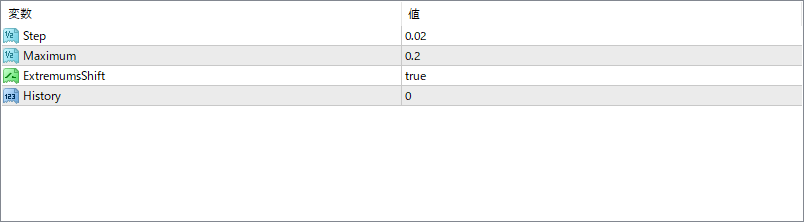
The screenshot above shows the default input parameters in the MT4 settings window.
| Parameter | Description |
|---|---|
| Step | This defines the sensitivity of the Parabolic SAR dots. Lower values make the indicator more sensitive to price changes, while higher values reduce noise but may delay signals. |
| Maximum | This sets the maximum acceleration factor for the Parabolic SAR. It determines how quickly the SAR will catch up to price in a trending move. |
| Deviation | Controls the ZigZag filtering by setting the minimum percentage move required to draw a new swing. Higher values ignore smaller fluctuations and only show major turns. |
| Backstep | Specifies how many bars back the indicator should look before confirming a new swing point. This prevents repainting and helps stabilize the zigzag formation. |


